Member Features
Find Real Estate Bargain!
Full foreclosure details
Home value, equity and ownership info
Find homes priced below market
Get full access with a FREE Account
Already a member?
$1,230,548
Listing Price3beds
2.5baths
2,272sqft
7,400sqft lot
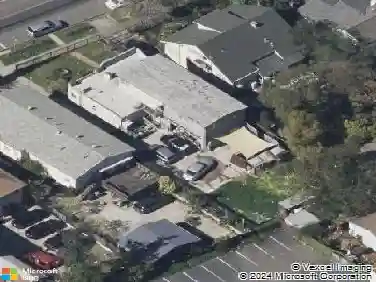
2929 Holyrood Dr, Oakland, CA 94611
Member Features
Find Real Estate Bargain!
Full foreclosure details
Home value, equity and ownership info
Find homes priced below market
Get full access with a FREE Account
Already a member?
For Sale
Off Market
Home type
Price / sqft
Year built
Home Details
Nestled in Montclairs coveted Piedmont Pines, 2929 Holyrood Drive is a sanctuary blending natural beauty, modern updates, and convenience. This lovingly maintained home features seamless indoor-outdoor living. The expansive living room boasts picturesque windows and cathedral ceilings, while a fireplace anchors a cozy seating area that opens up to the private front patio with lush landscaping. The dining room opens to a deck overlooking a quiet canyon. The kitchen-family room combo offers high-end quartz counters, a waterfall peninsula, and counter seating. The lower level includes three bedrooms, including a primary suite with a spa bath and walk-in closet, plus two bedrooms, and a full hall bath. An upstairs bonus space provides flexibility for work or relaxation. Additional perks include interior access from the two-car garage and extra storage. With easy access to Skyline Trails, transit, and Montclair Village, this home offers an unmatched lifestyle.
Interior Details
2272
3
2.5
Has Heating:
No
Heating Type:
N/A
Has Cooling:
No
Cooling Type:
N/A
Has Fuel:
No
Fuel Type:
N/A
Has Basement:
No
Basement Type:
N/A
Has Flooring:
No
Flooring Type:
N/A
Has Fireplace:
Yes
Fireplace Type:
N/A
Property Details
7400
No
No
Type:
N/A
Location:
N/A
Status:
N/A
Number of Spaces:
N/A
N/A
N/A
N/A
N/A
N/A
N/A
N/A
Construction Details
L-shape
N/A
N/A
N/A
N/A
Tax History
Year
Amount
Land
Improvement
Percent Change
Assessment
2020
$10,450
$197,095
$464,270
--%
$661,365
2019
$10,074
$193,232
$455,169
--%
$648,401
2018
$9,860
$189,444
$446,246
--%
$635,690
2017
$9,489
$185,730
$437,498
--%
$623,228
2016
$9,190
$182,089
$428,921
--%
$611,010
2014
$9,226
$175,841
$414,204
--%
$590,045
2013
$9,246
$175,047
$412,334
--%
$587,381
2012
$8,776
$171,616
$404,251
--%
$575,867

Average Home Price in 94611
Nearby Properties
Zip Code
Price
Bed
Bath
Sqft
Lot
Sold Date
$1,971,818
$1,971,818
2 Beds
2 Baths
1,956 Sqft
14,490 Lot (sqft)
Sold 08/26/2026
$1,579,187
$1,579,187
2 Beds
4 Baths
2,534 Sqft
11,800 Lot (sqft)
Sold 06/18/2026
$1,924,893
$1,924,893
4 Beds
3 Baths
2,335 Sqft
6,210 Lot (sqft)
Sold 06/18/2026
$1,798,000
$1,798,000
4 Beds
3 Baths
2,334 Sqft
15,600 Lot (sqft)
Sold 10/26/2026
$1,179,378
$1,179,378
3 Beds
2.5 Baths
2,308 Sqft
8,375 Lot (sqft)
Sold 10/13/2026
$1,187,556
$1,187,556
4 Beds
2 Baths
2,496 Sqft
7,809 Lot (sqft)
Sold 10/12/2026
$1,488,835
$1,488,835
4 Beds
3 Baths
2,026 Sqft
5,478 Lot (sqft)
Sold 09/29/2026
$1,230,548
$1,230,548
3 Beds
2.5 Baths
2,272 Sqft
7,400 Lot (sqft)
Sold 10/26/2026
$1,312,894
$1,312,894
3 Beds
3 Baths
2,382 Sqft
5,066 Lot (sqft)
Sold 10/26/2026