Fremont Property Market Calms After 2023 Highs; Stabilizes Early 2024 with Peak Median Value at $1.42M
The Fremont, California real estate market experienced considerable fluctuation throughout 2023 and into 2024, with significant peaks and stabilization across various parameters.


Key Takeaways
- Fremont's median sold price peaked at about $1.42 million in November 2023.
- By February 2024 it had eased to about $1.386 million.
- Average value and average sold price settled near $1.199 million by February 2024.
- Sales slowed from 1,565 in October 2023 to 1,395 in February 2024.
- Pleasanton stands out nearby with higher median values and price per square foot.
Fremont Real Estate Market Overview
The real estate market in Fremont, California, has captured attention due to its unique trajectory over the past year. In May 2023, we witnessed a significant surge in property values, with the median hitting approximately $1.395 million and average sold prices reaching nearly $1.401 million. This period stood out as a peak in the market, reflecting perhaps a high demand or a culmination of other economic variables.
However, as the months progressed, especially from June 2023 towards the early parts of 2024, the market saw a gradual decline. By February 2024, both the average value and the average sold price of homes appear to have stabilized at around $1.199 million. This suggests that the feverish pitch seen earlier in the year simmered down to a more sustainable level, hinting at a normalization following what may have been a period of intense competition among buyers or speculative investments.
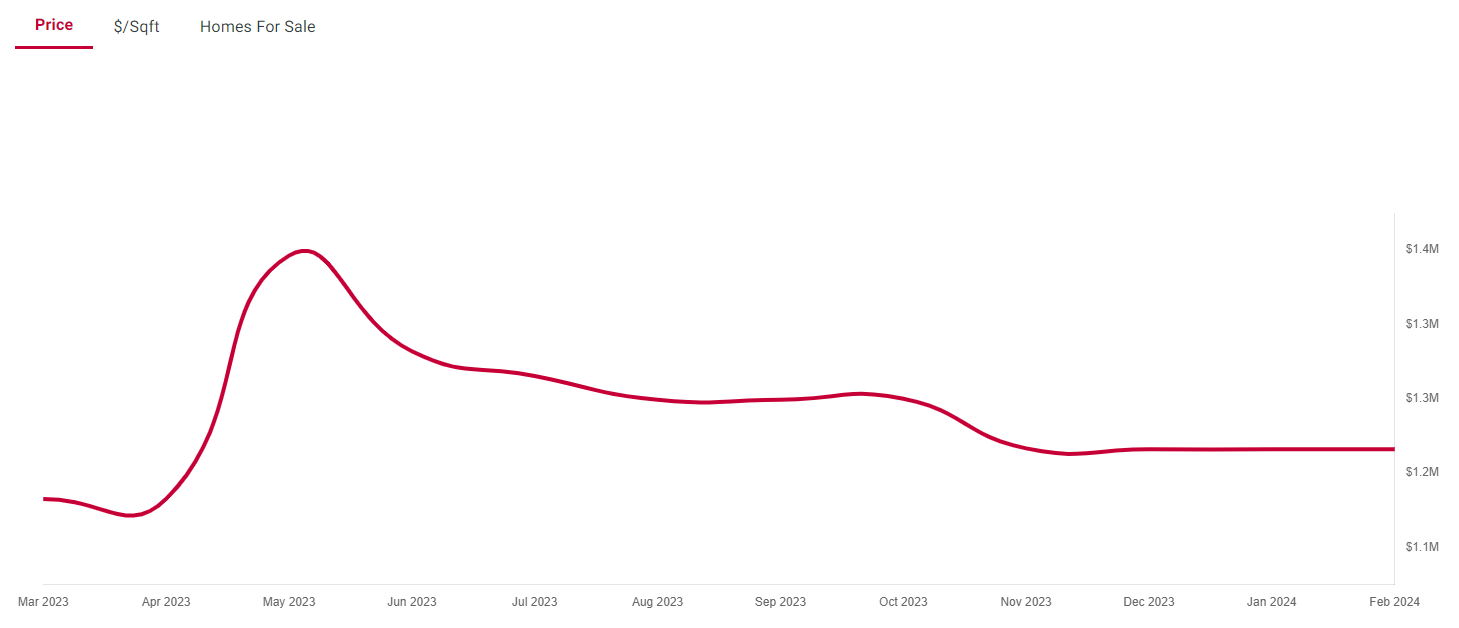
Interestingly, with the median sold price peaking in November 2023 at about $1.42 million before descending to approximately $1.386 million by February 2024, this potentially reflects a responsive cooling of the market. It’s indicative of a shift where buyers perhaps gained more negotiating power or where inventory levels may have caught up with demand.
Price Per Square Foot Analysis
The highest recorded value per sq ft in December 2023 was roughly $852 per square foot, which overshadowed the lower end of the spectrum recorded in January 2024 at about $757 per square foot. Such variations convey the dynamic nature of the Fremont real estate market in response to a myriad of factors including demand, inventory, and broader economic conditions.
Tracking the sold price per square foot presents a similar story of fluctuation, with August 2023 standing out with a high of approximately $944 per square foot. By February 2024, this had receded slightly to roughly $934 per square foot, once again indicating some market rebalancing after earlier peaks.
Inventory and Sales Dynamics
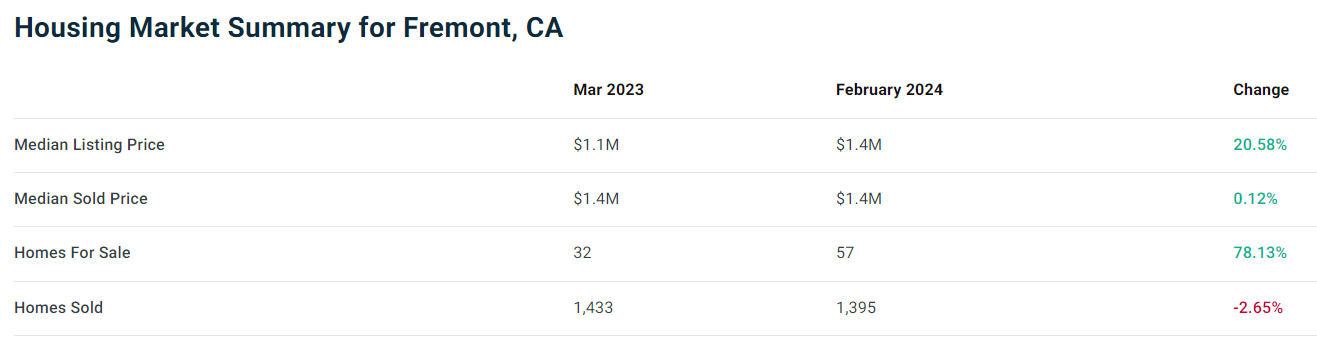
The Fremont housing market is also characterized by its changing inventory and sales volume. In October 2023, the market was particularly active with around 79 properties listed and a striking 1,565 properties sold. This disparity suggests a market where inventory was being absorbed at an incredibly fast rate, an environment usually indicative of high buyer demand and competitive bidding.
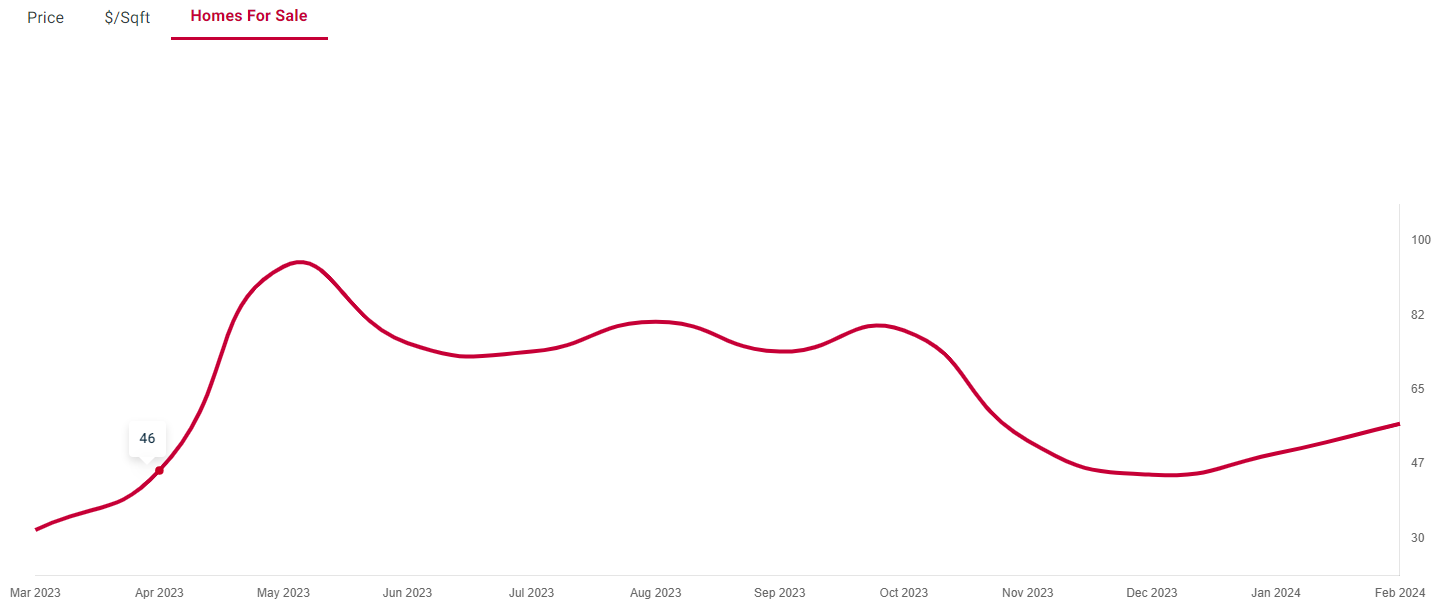
By comparison, the market in February 2024 showed a more moderate pace with 1,395 properties sold. Although this count is not significantly lower than the peak sales month, any downward trend may point towards changing buyer sentiment, potential increases in interest rates, or other economic shifts impacting consumer behavior.
Comparative Analysis with Nearby Cities
Fremont’s real estate market does not exist in a vacuum and indeed, when juxtaposed against neighboring cities such as Newark, Milpitas, Union City, and Pleasanton, we can see striking differences. Pleasanton, in particular, stands out with higher median values and price per square foot, setting it apart as the more premium market in the area. In contrast, the other cities, while still maintaining healthy markets, are more affordable in comparison. These disparities underscore regional economic diversities, local amenities, and demographic trends influencing homebuyer preferences across these locales.
Insight into Foreclosures
Although representing a smaller fraction of the market, foreclosure properties in Fremont including pre-foreclosures, auctions, and bank-owned homes offer a perspective on the health of the real estate landscape in Fremont. The presence of such properties reflects the economic realities that some homeowners face and presents an opportunity for investors. The low count compared to the broader market may indicate relative financial stability among homeowners and a potentially less competitive market for these distressed properties.
Frequently Asked Questions
What was the median home price in Fremont in early 2024?
The median sold price was about $1.386 million in February 2024, down from a peak of about $1.42 million in November 2023.
Is the Fremont housing market cooling?
Prices and sales eased from 2023 peaks into early 2024, which the report reads as the market settling to a more sustainable level.

About the author: Manuel Martinez
RealtyTrac contributor
Manuel Martinez is a contributor to RealtyTrac who writes about local housing markets, home buying and real estate investing. He has written for RealtyTrac since 2013, covering city and state market reports, home buying guides and tips, investment financing and strategies for buying and flipping homes.
More in Market Reports
Member Features
Find Real Estate Bargain!
Full foreclosure details
Home value, equity and ownership info
Find homes priced below market
Get full access with a FREE Account
Already a member?
Useful Guides


Useful Calculators
- Home Affordability CalculatorThe price range your income and debts support under the 28/36 rule.
- Rent vs. Buy CalculatorThe total cost of owning versus renting over your time in the home.
- Rental Property ROI CalculatorCash flow, NOI, cap rate and cash-on-cash return for a rental.