Member Features
Find Real Estate Bargain!
Full foreclosure details
Home value, equity and ownership info
Find homes priced below market
Get full access with a FREE Account
Already a member?
$1,616,510
Listing Price3beds
2.5baths
2,008sqft
6,531sqft lot
199 Wompatuck Rd, Hingham, MA 02043
Member Features
Find Real Estate Bargain!
Full foreclosure details
Home value, equity and ownership info
Find homes priced below market
Get full access with a FREE Account
Already a member?
For Sale
Off Market
Home type
Price / sqft
Year built
Home Details
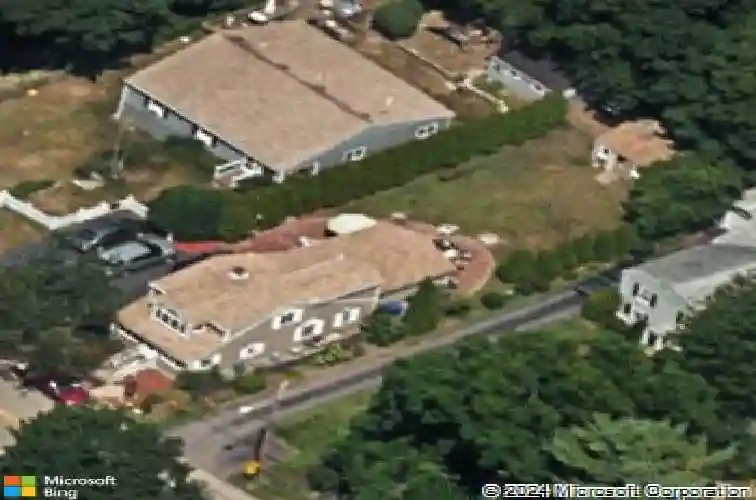
Welcome to 199 Wompatuck Road! Completely renovated in 2020, this stylish Crow Point home is located on one of the neighborhood's most beloved streets. Enjoy access to the neighborhood beach association w/ a swim dock, basketball hoop, beach hut, & stunning Boston skyline views, plus conservation trails leading to the Hingham Shipyard for commuter boat service, dining, & shopping. The private backyard is designed for coastal living with a patio, outdoor 'kitchen', firepit, and outdoor shower. Inside, the main level features a spacious mudroom, powder room, flexible office/playroom, and a beautifully updated kitchen with large island, stainless steel appliances, gas range, and a dining nook. The kitchen flows into the living room with direct access to the patio for seamless indoor/outdoor entertaining. Upstairs are 3 bedrooms and 2 full baths, including a vaulted primary suite with walk-in closet and gorgeous bath. Just moments from the new Foster Elementary School. This one has it all!
Interior Details
2008
3
2.5
Has Heating:
Yes
Heating Type:
Forced Air With Air Conditioning
Has Cooling:
Yes
Cooling Type:
N/A
Has Fuel:
Yes
Fuel Type:
Gas
Has Basement:
No
Basement Type:
Basement (unspecified)
Has Flooring:
No
Flooring Type:
N/A
Has Fireplace:
Yes
Fireplace Type:
N/A
Property Details
6531
No
No
Type:
Garage, Detached
Location:
N/A
Status:
N/A
Number of Spaces:
0
N/A
N/A
N/A
N/A
N/A
N/A
N/A
Construction Details
Conventional
Wood Siding
N/A
Gable
Asphalt
Tax History
Year
Amount
Land
Improvement
Percent Change
Assessment
2021
$6,955
$303,900
$285,500
--%
$589,400
2020
$6,796
$303,900
$285,500
--%
$589,400
2019
$6,742
$303,900
$267,000
--%
$570,900
2018
$6,598
$303,900
$256,700
--%
$560,600
2017
$5,564
$289,600
$164,600
--%
$454,200
2015
$5,354
$262,700
$164,600
--%
$427,300
2014
$4,367
$172,500
$175,200
--%
$347,700
2013
$4,284
$172,500
$175,200
--%
$347,700

Average Home Price in 02043
Nearby Properties
Zip Code
Price
Bed
Bath
Sqft
Lot
Sold Date
$1,498,254
$1,498,254
4 Beds
2.5 Baths
2,103 Sqft
4,886 Lot (sqft)
Sold 10/27/2026
$1,616,510
$1,616,510
3 Beds
2.5 Baths
2,008 Sqft
6,531 Lot (sqft)
Sold 10/26/2026
$972,170
3 Beds
1.5 Baths
1,836 Sqft
8,772 Lot (sqft)
Sold 10/27/2026
$1,099,000
$1,099,000
3 Beds
2 Baths
1,879 Sqft
7,500 Lot (sqft)
Sold 10/26/2026