Member Features
Find Real Estate Bargain!
Full foreclosure details
Home value, equity and ownership info
Find homes priced below market
Get full access with a FREE Account
Already a member?
$189,000
Listing Price3beds
2baths
1,448sqft
10,258sqft lot
4350 Tanglebrook Dr, Black Jack, MO 63033
Member Features
Find Real Estate Bargain!
Full foreclosure details
Home value, equity and ownership info
Find homes priced below market
Get full access with a FREE Account
Already a member?
For Sale
Home type
Price / sqft
Year built
Home Details
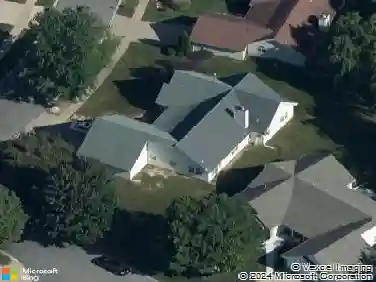
This spacious 3 bedroom 2 full bath home offers good sized patio in rear with a nice level lot backing to woods and common ground. Enjoy the view of the open space. Great convenient location with wonderful access to major roads and area amenities but situated on quiet street in established area. Nice curb appeal with brick front, concrete driveway, updated front and rear exterior doors, thermal windows, low-maintenance vinyl siding and enclosed soffits plus 2-car garage. Features include: Master Suite w/private bath, 2 Guest Bedrooms, Formal Dining Room, Formal Living Room, large Family Room w/fireplace. Breakfast room w/huge bay window for ultimate view of privacy and nature. Kitchen w/center island w/breakfast bar, great natural light and additional recessed lighting. Full basement for future expansion of living space. Tremendous opportunity for investor or owner occupant desiring built-in sweat equity for future return. Sold As Is. Needs some TLC but don't hesitate to come inside!
Interior Details
1448
3
2
Has Heating:
Yes
Heating Type:
Yes
Has Cooling:
Yes
Cooling Type:
Central
Has Fuel:
Yes
Fuel Type:
Electric
Has Basement:
No
Basement Type:
Full
Has Flooring:
No
Flooring Type:
N/A
Has Fireplace:
Yes
Fireplace Type:
N/A
Property Details
10258
Yes
Yes
Type:
Garage, Attached
Location:
N/A
Status:
N/A
Number of Spaces:
2
No
No
No
No
Yes
No
No
Construction Details
Ranch
Aluminum/vinyl
N/A
N/A
N/A
Tax History
Year
Amount
Land
Improvement
Percent Change
Assessment
2020
$2,471
$4,600
$18,490
--%
$23,090
2019
$2,437
$4,600
$18,490
--%
$23,090
2018
$2,345
$2,810
$17,710
--%
$20,520
2017
$2,343
$2,810
$17,710
--%
$20,520
2016
$2,492
$2,810
$18,620
--%
$21,430
2013
$2,220
$3,900
$16,400
--%
$20,300
2013
$2,220
$3,900
$16,400
--%
$20,300
2012
$2,120
$3,610
$16,950
--%
$20,560

Average Home Price in 63033
Nearby Properties
Zip Code
Price
Bed
Bath
Sqft
Lot
Sold Date
$208,838
3 Beds
2 Baths
1,620 Sqft
13,443 Lot (sqft)
Sold 09/23/2026
$321,452
3 Beds
2 Baths
1,640 Sqft
15,246 Lot (sqft)
Sold 08/30/2026
$270,640
3 Beds
3 Baths
1,428 Sqft
10,293 Lot (sqft)
Sold 10/27/2026
$249,900
$249,900
3 Beds
2 Baths
1,443 Sqft
10,123 Lot (sqft)
Sold 10/27/2026
$185,429
3 Beds
2 Baths
1,479 Sqft
10,934 Lot (sqft)
Sold 10/26/2026
$189,000
3 Beds
2 Baths
1,448 Sqft
10,258 Lot (sqft)
Sold 09/29/2026
$247,150
3 Beds
2 Baths
1,650 Sqft
10,441 Lot (sqft)
Sold 10/26/2026
$239,900
3 Beds
3 Baths
1,620 Sqft
11,474 Lot (sqft)
Sold 10/26/2026
$251,972
$251,972
3 Beds
2 Baths
1,635 Sqft
11,304 Lot (sqft)
Sold 10/26/2026