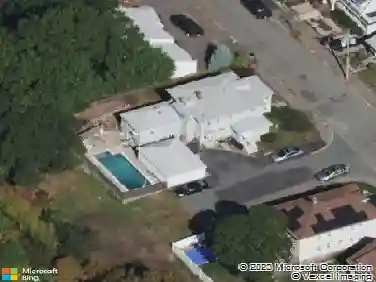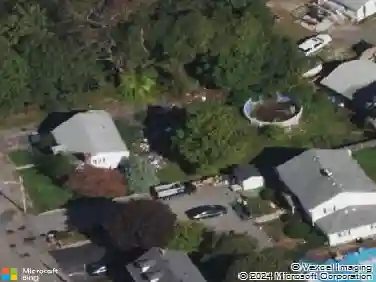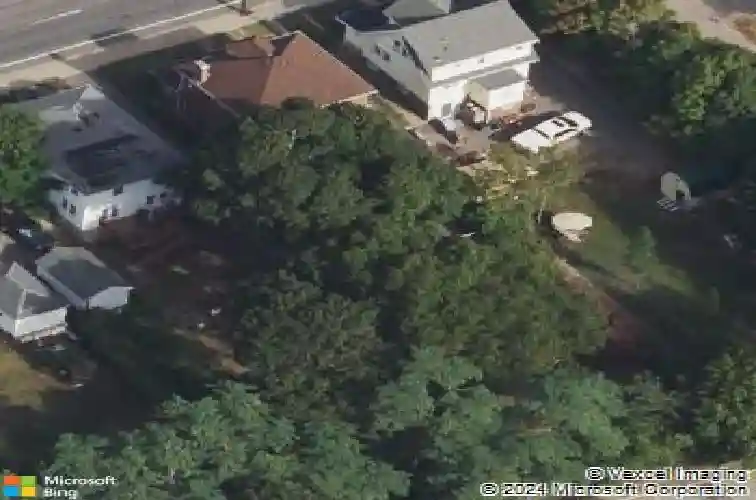
Member Features
Find Real Estate Bargain!
Full foreclosure details
Home value, equity and ownership info
Find homes priced below market
Get full access with a FREE Account
Already a member?
$836,856
Listing Price5beds
2baths
1,754sqft
9,092sqft lot
195 Sea St, Quincy, MA 02169
Member Features
Find Real Estate Bargain!
Full foreclosure details
Home value, equity and ownership info
Find homes priced below market
Get full access with a FREE Account
Already a member?
For Sale
Off Market
Home type
Price / sqft
Year built
Home Details
OPEN HOUSE CANCELED - OFFER ACCEPTED!! Located in desirable Merrymount, this brick colonial, set on a 9,000+ sq ft lot with huge potential, this 5 bed, 2 full bath home features a stunning 2022 custom kitchen w/ new cabinetry, granite countertops, tile backsplash, peninsula with breakfast bar, KitchenAid stainless appliances, tile flooring, and recessed lighting. Additional highlights include 2 updated full baths, enclosed 4 season porch or study, wood burning fireplace, mudroom, updated plumbing & electrical, new oil tank, and beautifully preserved original woodwork throughout. The partially finished lower level offers strong in law potential with a 5th bedroom, full bath, flex space ideal for a gym, media room or office, laundry, ample storage, and direct walk out access to the expansive backyard with fire pit, perfect for entertaining or future expansion. Close to highways, public transit, dining, and shopping. Enjoy Merrymount Association w/ private beach ($195 Annually).
Interior Details
1754
5
2
Has Heating:
Yes
Heating Type:
Steam
Has Cooling:
No
Cooling Type:
N/A
Has Fuel:
Yes
Fuel Type:
Oil
Has Basement:
No
Basement Type:
Full
Has Flooring:
No
Flooring Type:
N/A
Has Fireplace:
Yes
Fireplace Type:
N/A
Property Details
9092
No
No
Type:
N/A
Location:
N/A
Status:
N/A
Number of Spaces:
N/A
N/A
N/A
N/A
N/A
N/A
N/A
N/A
Construction Details
Colonial
Brick
N/A
Gable
Asphalt
Tax History
Year
Amount
Land
Improvement
Percent Change
Assessment
2020
$5,285
$196,200
$229,000
--%
$425,200
2019
$5,036
$183,500
$217,800
--%
$401,300
2018
$4,957
$170,000
$201,600
--%
$371,600
2017
$4,996
$170,000
$182,600
--%
$352,600
2016
$5,004
$177,900
$170,600
--%
$348,500
2014
$4,540
$161,900
$143,600
--%
$305,500
2013
$4,415
$161,900
$142,600
--%
$304,500

Average Home Price in 02169
Nearby Properties
Zip Code
Price
Bed
Bath
Sqft
Lot
Sold Date
$615,406
4 Beds
1 Baths
1,654 Sqft
5,478 Lot (sqft)
Sold 08/06/2026
$929,375
$929,375
3 Beds
2.5 Baths
1,785 Sqft
5,184 Lot (sqft)
Sold 10/27/2026
$725,000
$725,000
3 Beds
1.5 Baths
1,520 Sqft
5,152 Lot (sqft)
Sold 10/27/2026
$875,000
$875,000
3 Beds
2 Baths
1,557 Sqft
5,852 Lot (sqft)
Sold 10/27/2026
$864,900
$864,900
4 Beds
2 Baths
1,722 Sqft
5,050 Lot (sqft)
Sold 05/31/2021
$1,020,523
$1,020,523
4 Beds
2.5 Baths
1,630 Sqft
7,607 Lot (sqft)
Sold 10/26/2026
$836,856
$836,856
5 Beds
2 Baths
1,754 Sqft
9,092 Lot (sqft)
Sold 10/26/2026
$899,000
3 Beds
3 Baths
1,493 Sqft
5,506 Lot (sqft)
Sold 10/13/2026
$799,000
$799,000
4 Beds
3 Baths
1,650 Sqft
4,952 Lot (sqft)
Sold 10/13/2026