Member Features
Find Real Estate Bargain!
Full foreclosure details
Home value, equity and ownership info
Find homes priced below market
Get full access with a FREE Account
Already a member?
$2,500,000
Listing Price3beds
2baths
1,650sqft
203,273sqft lot
809 Sandwich Rd, East Falmouth, MA 02536
Member Features
Find Real Estate Bargain!
Full foreclosure details
Home value, equity and ownership info
Find homes priced below market
Get full access with a FREE Account
Already a member?
For Sale
Pending
Off Market
Home type
Price / sqft
Year built
Home Details
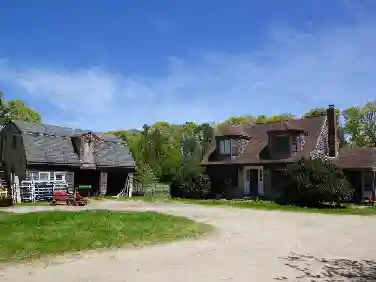
Great Land for development. Cape style Home on a Horse Farm with 30 indoor stalls. Turnouts and outbuildings included. Most of property is fenced. Almost 20 Acres of good land, great for developing.
Interior Details
1650
3
2
Has Heating:
Yes
Heating Type:
Forced Air With Air Conditioning
Has Cooling:
Yes
Cooling Type:
N/A
Has Fuel:
Yes
Fuel Type:
Gas
Has Basement:
No
Basement Type:
Unfinished
Has Flooring:
No
Flooring Type:
N/A
Has Fireplace:
Yes
Fireplace Type:
N/A
Property Details
203273
No
No
Type:
Garage, Detached
Location:
N/A
Status:
N/A
Number of Spaces:
0
N/A
N/A
N/A
N/A
N/A
N/A
N/A
Construction Details
Cape Cod
Wood Siding
N/A
Gable
Asphalt
Tax History
Year
Amount
Land
Improvement
Percent Change
Assessment
2020
$5,769
$220,800
$450,800
--%
$671,600
2019
$5,712
$220,800
$446,500
--%
$667,300
2018
$5,641
$220,800
$435,100
--%
$655,900
2017
$5,338
$189,800
$436,000
--%
$625,800
2016
$5,238
$189,800
$436,000
--%
$625,800
2014
$4,465
$198,300
$349,500
--%
$547,800
2013
$4,360
$198,300
$344,000
--%
$542,300

Average Home Price in 02536
Nearby Properties
Zip Code
Price
Bed
Bath
Sqft
Lot
Sold Date
$723,225
3 Beds
2.5 Baths
1,612 Sqft
18,400 Lot (sqft)
Sold 10/26/2026
$2,500,000
$2,500,000
3 Beds
2 Baths
1,650 Sqft
203,273 Lot (sqft)
Sold 10/26/2026
$552,752
3 Beds
2 Baths
1,548 Sqft
17,850 Lot (sqft)
Sold 10/27/2026
$647,132
3 Beds
1 Baths
1,652 Sqft
54,148 Lot (sqft)
Sold 10/26/2026