Member Features
Find Real Estate Bargain!
Full foreclosure details
Home value, equity and ownership info
Find homes priced below market
Get full access with a FREE Account
Already a member?
$744,511
Listing Price3beds
1baths
1,232sqft
6,093sqft lot
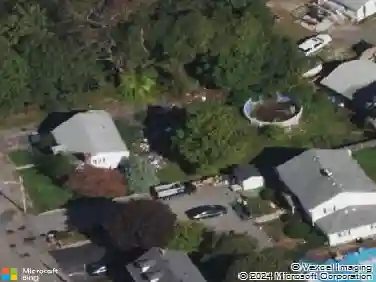
36 Russell St, Quincy, MA 02171
Member Features
Find Real Estate Bargain!
Full foreclosure details
Home value, equity and ownership info
Find homes priced below market
Get full access with a FREE Account
Already a member?
For Sale
Off Market
Home type
Price / sqft
Year built
Home Details
Welcome to this well-cared-for Cape tucked away on a quiet side street in a prime North Quincy location, just moments from Wollaston Beach and Quincy Shore Drive with convenient access into Boston. Deceptively spacious, the home features hardwood flooring, gas heat, a bright fireplaced living room, and an open kitchen and dining area with cathedral ceilings. A first-floor bedroom and full bath offer the flexibility of one-level living, while the upstairs primary suite features two closets and a private en-suite bath. The full basement includes laundry, a half bath, bulkhead access, excellent storage, and space for a home gym. Nothing to do but move in, with a new roof, vinyl siding, low-maintenance deck, expanded driveway, and front walkway. A gas line is also in place for a future gas fireplace. Enjoy a spacious backyard with room to relax, garden, or entertain-all close to North Quincy MBTA Station and Marina Bays waterfront dining, shopping, and marina.
Interior Details
1232
3
1
Has Heating:
Yes
Heating Type:
Steam
Has Cooling:
No
Cooling Type:
N/A
Has Fuel:
Yes
Fuel Type:
Gas
Has Basement:
No
Basement Type:
Basement (unspecified)
Has Flooring:
No
Flooring Type:
N/A
Has Fireplace:
Yes
Fireplace Type:
N/A
Property Details
6093
No
No
Type:
N/A
Location:
N/A
Status:
N/A
Number of Spaces:
N/A
N/A
N/A
N/A
N/A
N/A
N/A
N/A
Construction Details
Cape Cod
Aluminum/vinyl
N/A
Gable
Asphalt
Tax History
Year
Amount
Land
Improvement
Percent Change
Assessment
2020
$5,662
$277,000
$178,500
--%
$455,500
2019
$5,316
$266,300
$157,300
--%
$423,600
2018
$5,400
$253,700
$151,100
--%
$404,800
2017
$5,083
$230,600
$128,100
--%
$358,700
2016
$4,816
$209,600
$125,800
--%
$335,400
2014
$4,298
$190,600
$98,600
--%
$289,200
2013
$4,275
$190,600
$104,200
--%
$294,800

Average Home Price in 02171
Nearby Properties
Zip Code
Price
Bed
Bath
Sqft
Lot
Sold Date
$513,967
$513,967
2 Beds
1 Baths
1,080 Sqft
3,235 Lot (sqft)
Sold 07/30/2026
$806,911
$806,911
3 Beds
2 Baths
1,056 Sqft
3,200 Lot (sqft)
Sold 06/03/2026
$720,974
$720,974
3 Beds
2 Baths
1,412 Sqft
3,375 Lot (sqft)
Sold 10/26/2026
$807,831
$807,831
3 Beds
1 Baths
1,344 Sqft
3,465 Lot (sqft)
Sold 10/27/2026
$680,406
$680,406
3 Beds
1.5 Baths
1,300 Sqft
3,150 Lot (sqft)
Sold 10/27/2026
$821,167
$821,167
3 Beds
1.5 Baths
1,380 Sqft
4,000 Lot (sqft)
Sold 10/26/2026
$582,147
$582,147
3 Beds
1.5 Baths
1,302 Sqft
6,088 Lot (sqft)
Sold NaN/NaN/NaN
$744,511
$744,511
3 Beds
1 Baths
1,232 Sqft
6,093 Lot (sqft)
Sold 10/27/2026
$726,394
$726,394
3 Beds
2 Baths
1,226 Sqft
3,200 Lot (sqft)
Sold 10/26/2026