Member Features
Find Real Estate Bargain!
Full foreclosure details
Home value, equity and ownership info
Find homes priced below market
Get full access with a FREE Account
Already a member?
$1,516,084
Sold Price2beds
1baths
1,327sqft
3,850sqft lot
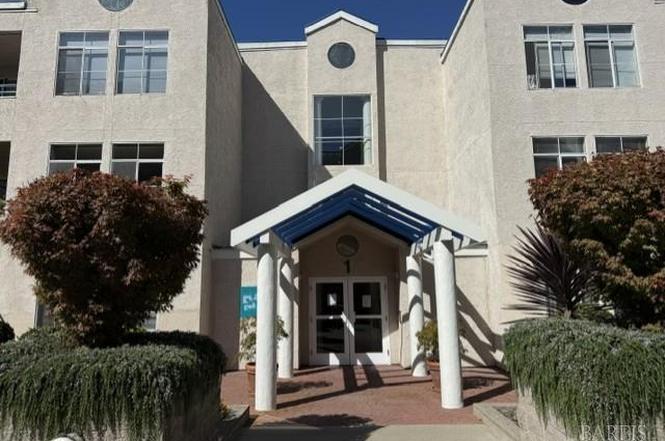
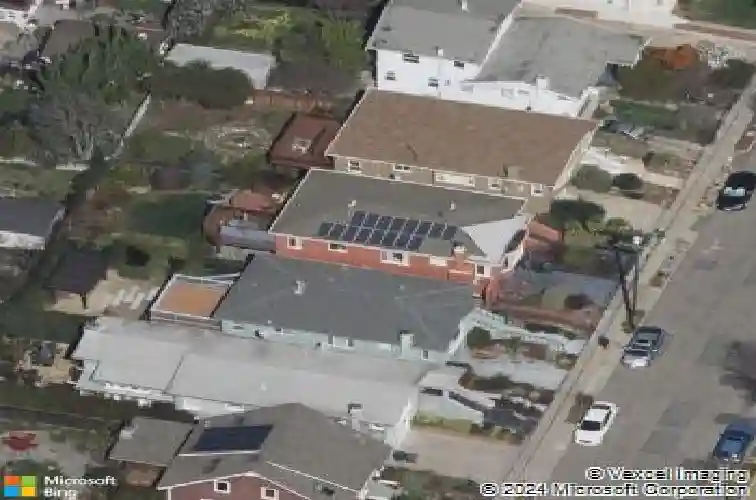
1038 Ordway St, Albany, CA 94706
Member Features
Find Real Estate Bargain!
Full foreclosure details
Home value, equity and ownership info
Find homes priced below market
Get full access with a FREE Account
Already a member?
Recently Sold
Off Market
Home type
Price / sqft
Year built
Home Details
Interior Details
1327
2
1
Has Heating:
No
Heating Type:
N/A
Has Cooling:
No
Cooling Type:
N/A
Has Fuel:
No
Fuel Type:
N/A
Has Basement:
No
Basement Type:
N/A
Has Flooring:
No
Flooring Type:
N/A
Has Fireplace:
Yes
Fireplace Type:
N/A
Property Details
3850
No
No
Type:
N/A
Location:
N/A
Status:
N/A
Number of Spaces:
N/A
N/A
N/A
N/A
N/A
N/A
N/A
N/A
Construction Details
L-shape
N/A
N/A
N/A
N/A
Tax History
Year
Amount
Land
Improvement
Percent Change
Assessment
2020
$12,890
$227,237
$530,221
--%
$757,458
2019
$12,605
$222,783
$519,827
--%
$742,610
2018
$12,250
$218,415
$509,637
--%
$728,052
2017
$11,946
$214,134
$499,647
--%
$713,781
2016
$11,376
$209,937
$489,853
--%
$699,790
2014
$10,517
$202,735
$473,048
--%
$675,783
2013
$11,142
$201,820
$470,914
--%
$672,734
2012
$10,640
$197,863
$461,681
--%
$659,544

Average Home Price in 94706
Nearby Properties
Zip Code
Price
Bed
Bath
Sqft
Lot
Sold Date
$1,486,405
$1,486,405
2 Beds
2.5 Baths
1,500 Sqft
4,360 Lot (sqft)
Sold 10/28/2026
$1,721,729
$1,721,729
3 Beds
1 Baths
1,355 Sqft
4,480 Lot (sqft)
Sold 10/22/2026
$1,687,540
$1,687,540
2 Beds
1 Baths
1,318 Sqft
4,140 Lot (sqft)
Sold 10/07/2026
$1,565,413
$1,565,413
2 Beds
1 Baths
1,152 Sqft
3,800 Lot (sqft)
Sold 10/01/2026
$1,243,096
$1,243,096
3 Beds
1 Baths
1,315 Sqft
3,850 Lot (sqft)
Sold 09/30/2026
$971,005
$971,005
2 Beds
2 Baths
1,267 Sqft
5,000 Lot (sqft)
Sold 09/10/2026
$1,262,040
$1,262,040
2 Beds
1 Baths
1,208 Sqft
5,000 Lot (sqft)
Sold 09/01/2026
$1,412,109
$1,412,109
3 Beds
1 Baths
1,336 Sqft
3,640 Lot (sqft)
Sold 08/25/2026
$1,450,826
$1,450,826
2 Beds
1.5 Baths
1,260 Sqft
3,400 Lot (sqft)
Sold 08/14/2026