Member Features
Find Real Estate Bargain!
Full foreclosure details
Home value, equity and ownership info
Find homes priced below market
Get full access with a FREE Account
Already a member?
$1,962,854
Sold Price4beds
2.5baths
2,531sqft
9,996sqft lot
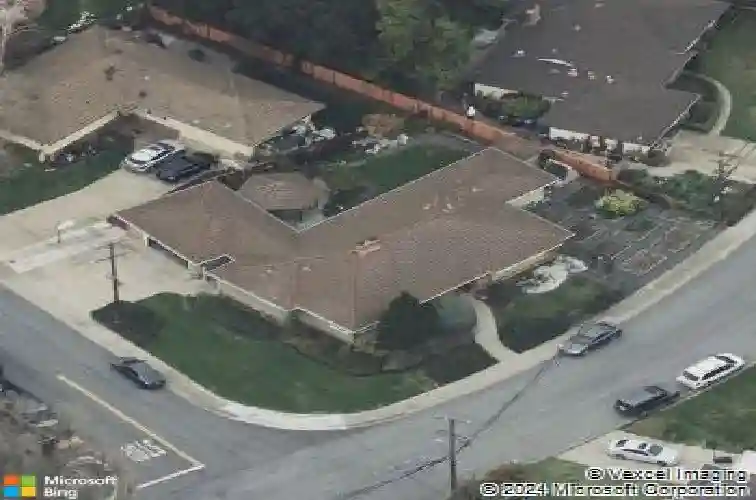
235 Orchard Dr, Fremont, CA 94536
Member Features
Find Real Estate Bargain!
Full foreclosure details
Home value, equity and ownership info
Find homes priced below market
Get full access with a FREE Account
Already a member?
Recently Sold
Off Market
Home type
Price / sqft
Year built
Home Details
Interior Details
2531
4
2.5
Has Heating:
Yes
Heating Type:
Forced Air With Air Conditioning
Has Cooling:
Yes
Cooling Type:
Central
Has Fuel:
No
Fuel Type:
N/A
Has Basement:
No
Basement Type:
N/A
Has Flooring:
No
Flooring Type:
N/A
Has Fireplace:
Yes
Fireplace Type:
N/A
Property Details
9996
Yes
Yes
Type:
N/A
Location:
N/A
Status:
N/A
Number of Spaces:
N/A
N/A
N/A
N/A
N/A
N/A
N/A
N/A
Construction Details
L-shape
Stucco
N/A
N/A
Wood Shingle
Tax History
Year
Amount
Land
Improvement
Percent Change
Assessment
2020
$3,042
$60,889
$154,435
--%
$215,324
2019
$3,010
$59,695
$151,407
--%
$211,102
2018
$2,947
$58,525
$148,438
--%
$206,963
2017
$2,873
$57,377
$145,528
--%
$202,905
2016
$2,811
$56,252
$142,675
--%
$198,927
2014
$2,705
$54,322
$137,780
--%
$192,102
2013
$2,569
$54,077
$137,158
--%
$191,235
2012
$2,459
$53,017
$134,469
--%
$187,486

Average Home Price in 94536
Nearby Properties
Zip Code
Price
Bed
Bath
Sqft
Lot
Sold Date
$1,710,648
$1,710,648
4 Beds
3 Baths
2,340 Sqft
5,700 Lot (sqft)
Sold 10/28/2026
$871,531
$871,531
4 Beds
3 Baths
2,609 Sqft
7,500 Lot (sqft)
Sold 10/20/2026
$2,297,787
$2,297,787
4 Beds
2.5 Baths
2,847 Sqft
6,000 Lot (sqft)
Sold 10/16/2026
$1,930,611
$1,930,611
5 Beds
4 Baths
2,477 Sqft
6,014 Lot (sqft)
Sold 10/16/2026
$2,068,526
$2,068,526
4 Beds
3 Baths
2,208 Sqft
8,319 Lot (sqft)
Sold 07/07/2026
$1,700,000
$1,700,000
4 Beds
3 Baths
2,523 Sqft
5,141 Lot (sqft)
Sold 10/05/2026
$2,208,280
$2,208,280
4 Beds
-- Baths
2,871 Sqft
8,086 Lot (sqft)
Sold 10/27/2026
$2,001,350
$2,001,350
-- Beds
-- Baths
2,186 Sqft
9,314 Lot (sqft)
Sold 10/27/2026
$2,030,479
$2,030,479
4 Beds
2.5 Baths
2,413 Sqft
7,842 Lot (sqft)
Sold 10/26/2026
Calculators
Mortgage
Mortgage Calculator
Details for 235 ORCHARD DR
Property Debt
Foreclosure Contact Details
Similar Homes Nearby

Guides for Orchard Dr

The Fremont, California real estate market experienced considerable fluctuation throughout 2023 and into 2024, with significant peaks and stabilization across various parameters.