Member Features
Find Real Estate Bargain!
Full foreclosure details
Home value, equity and ownership info
Find homes priced below market
Get full access with a FREE Account
Already a member?
$2,448,876
Sold Price4beds
3.5baths
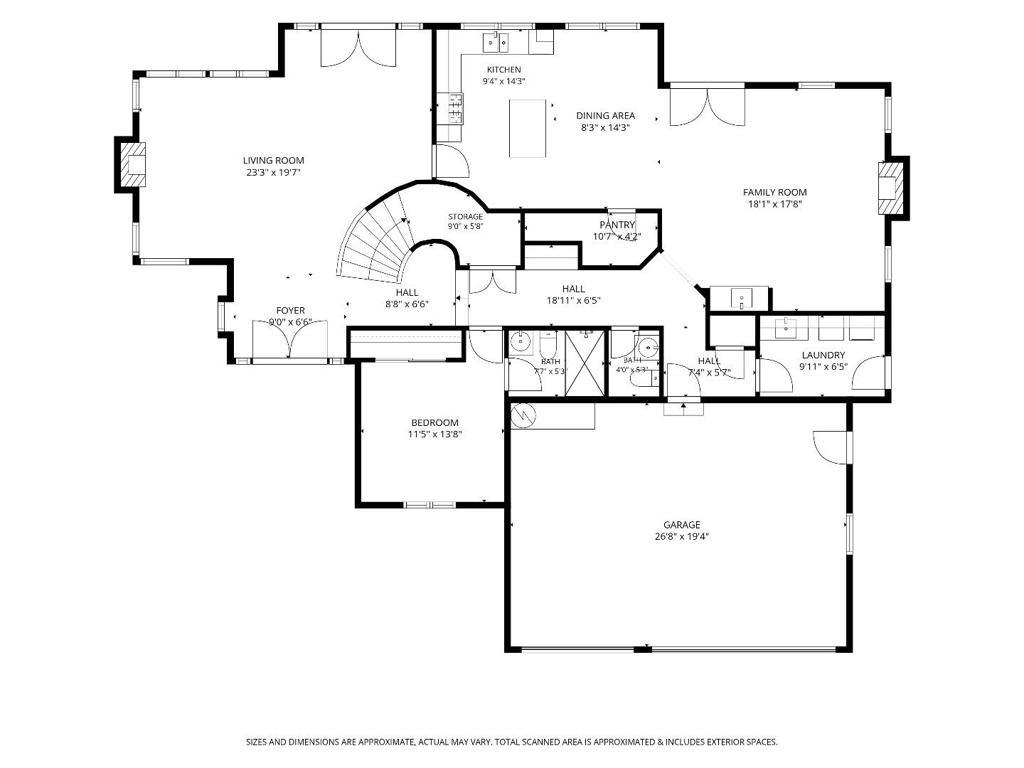
2,661sqft
17,766sqft lot
1144 Olive Branch Ln, San Jose, CA 95120
Member Features
Find Real Estate Bargain!
Full foreclosure details
Home value, equity and ownership info
Find homes priced below market
Get full access with a FREE Account
Already a member?
Recently Sold
Off Market
Home type
Price / sqft
Year built
Home Details
Interior Details
2661
4
3.5
Has Heating:
Yes
Heating Type:
Yes
Has Cooling:
No
Cooling Type:
N/A
Has Fuel:
No
Fuel Type:
N/A
Has Basement:
No
Basement Type:
N/A
Has Flooring:
No
Flooring Type:
N/A
Has Fireplace:
Yes
Fireplace Type:
N/A
Property Details
17766
Yes
Yes
Type:
N/A
Location:
N/A
Status:
N/A
Number of Spaces:
N/A
No
No
No
No
Yes
No
No
Construction Details
L-shape
Stucco
N/A
N/A
Tile
Tax History
Year
Amount
Land
Improvement
Percent Change
Assessment
2020
$16,573
$822,369
$489,891
--%
$1,312,260
2019
$16,247
$806,245
$480,286
--%
$1,286,531
2018
$16,161
$790,437
$470,869
--%
$1,261,306
2017
$16,041
$774,939
$461,637
--%
$1,236,576
2016
$15,822
$759,745
$452,586
--%
$1,212,331
2014
$14,751
$733,675
$409,056
--%
$1,142,731
2013
$14,433
$730,360
$393,271
--%
$1,123,631
2012
$12,034
$690,300
$371,700
--%
$1,062,000

Average Home Price in 95120
Nearby Properties
Zip Code
Price
Bed
Bath
Sqft
Lot
Sold Date
$2,883,987
$2,883,987
4 Beds
3 Baths
2,316 Sqft
11,500 Lot (sqft)
Sold 10/20/2026
$2,448,876
$2,448,876
4 Beds
3.5 Baths
2,661 Sqft
17,766 Lot (sqft)
Sold 09/22/2026
$3,013,130
$3,013,130
4 Beds
3.5 Baths
2,875 Sqft
10,118 Lot (sqft)
Sold 08/27/2026
$2,224,156
$2,224,156
4 Beds
3 Baths
2,324 Sqft
10,200 Lot (sqft)
Sold 07/21/2026
$2,896,223
$2,896,223
4 Beds
2.5 Baths
2,840 Sqft
21,820 Lot (sqft)
Sold 07/13/2026
$2,448,537
$2,448,537
4 Beds
2 Baths
2,498 Sqft
14,436 Lot (sqft)
Sold 06/05/2026
$2,378,249
$2,378,249
5 Beds
2.5 Baths
2,425 Sqft
10,260 Lot (sqft)
Sold 05/21/2026
$2,852,800
$2,852,800
4 Beds
2.5 Baths
2,486 Sqft
12,350 Lot (sqft)
Sold 10/27/2026
$3,111,958
$3,111,958
3 Beds
2.5 Baths
2,356 Sqft
13,755 Lot (sqft)
Sold 10/26/2026