Diverse Trends Emerge in San Jose Real Estate Market amid Rising Sold Prices
San Jose’s real estate market shows dynamic trends with fluctuating average property values, consistent increase in sold prices, variations in listed properties, and differences across various neighborhoods.


Key Takeaways
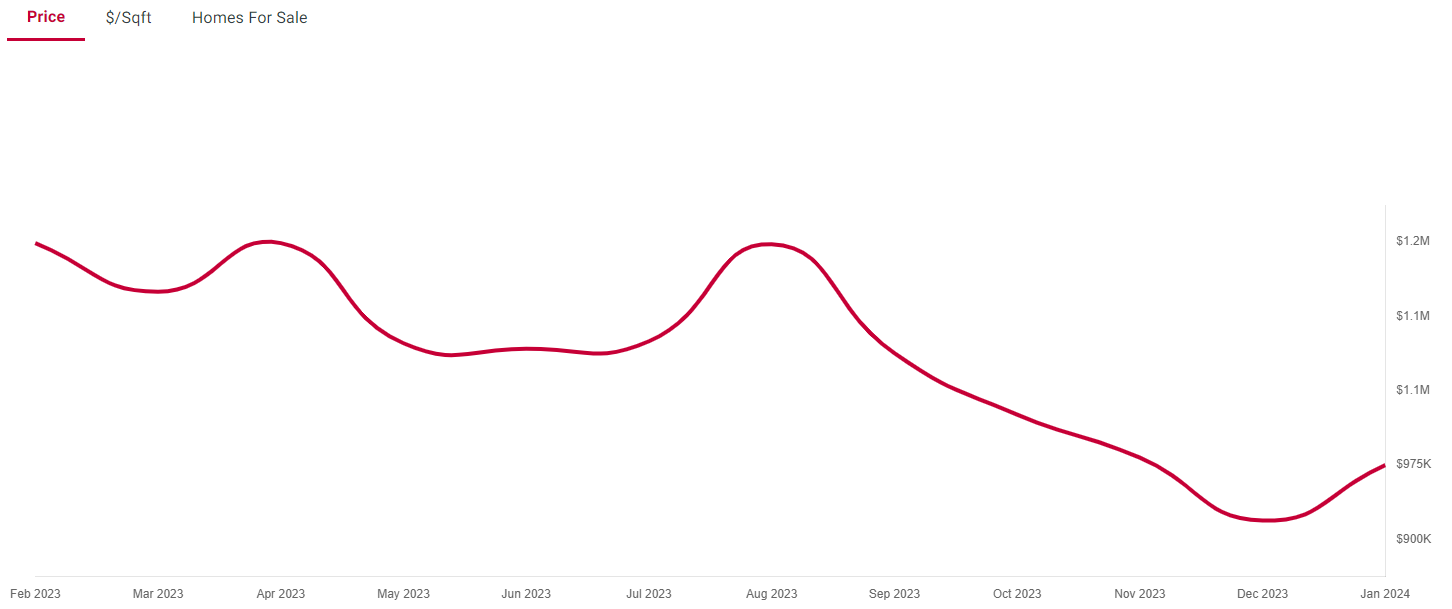
- San Jose's average value fell from $1,088,000 in September 2023 to $919,000 in December, then reached $975,000 in January 2024.
- The average sold price rose from about $1,313,604 in August 2023 to about $1,349,114 in January 2024.
- Listings peaked at 241 in October 2023 and dipped to 144 in December.
- Campbell averaged $1,874,000 in January 2024, well above San Jose.
The San Jose real estate market has been remarkable dynamic in recent months. While grappling with common factors such as economic shifts and buyer sentiment, certain patterns have emerged. Perhaps most notably, the average value of properties experienced fluctuations—a typical sign of a market responding to various external pressures. For instance, a decline from September 2023’s average value of $1,088,000 to December 2023’s $919,000 was observed, only to rebound to $975,000 in January 2024. These shifts could indicate reactive pricing strategies by sellers in order to align with the market’s demand and supply dynamics.
While average values moved up and down throughout the year, a contrasting trend was observed in average sold prices, which consistently marched upwards. For example, August 2023 saw an average sold price of about $1,313,604, and by January 2024, this figure had ascended slightly to approximately $1,349,114. Delving into the price per square foot—a metric that offers a standardized measure of value irrespective of property size—the upwards trajectory continued with an increase from roughly $833 in August 2023 to around $834 in January 2024.
The number of properties listed in San Jose, indicated by the property count, also varied with notable peaks and troughs. Peak listing activity in October 2023 saw 241 properties hitting the market, while December of the same year exhibited a significant dip with only 144 properties listed. This variation could suggest a seasonal inclination in listing behavior or potential shifts in market confidence.
When we extend our gaze to neighboring cities within Santa Clara County, the comparison becomes even more interesting. Campbell and Santa Clara stood out with higher average sold prices per square foot than San Jose, hinting at potentially increased demand or desirability in these locales.
Comparative Analysis and Nearby Cities
A granular look at data from surrounding areas reveals substantial differences in real estate values. Take January 2024: while San Jose displayed an average value of about $975,000 with a price per square foot of approximately $701, Campbell eclipsed these figures with an average value of $1,874,000 and a price per square foot of around $1,061. This substantial gap suggests that properties in Campbell fetch a premium, likely due to factors such as school districts, community amenities, or lower supply relative to demand.
The real estate market is not monolithic; different neighborhoods within a city can reflect divergent market conditions. This is evident when comparing median values and prices per square foot across the various submarkets within San Jose. A stark contrast emerges between zip code 95125, where the median list price soars to about $1,800,000, and zip code 95113, where the median list price is a more modest $632,000. This disparity showcases the diverse appeal and value affiliated with San Jose’s numerous neighborhoods.
Sold Prices, Active Market, and Market Summary
Digging deeper into transaction values, data over the past six months points to an median house prices of approximately $1,236m. Interestingly, this is marginally higher than the median value of actively listed properties, which comes in at about $1,208m. Sold properties command a premium, indicated by their higher median value of approximately $1,344,077 when compared to active listings. This may suggest that properties transacting are either higher-valued inherently or that market values have experienced appreciation over the period in question.
The San Jose real estate market, with its fluctuations in values, rising sold prices, and the diverse appeal of its neighborhoods, presents a complex and vibrant landscape. For those considering taking part in this market, it is imperative to scrutinize the trends, month-over-month changes, and localized conditions that dictate real estate dynamics in this hub of Silicon Valley.
Frequently Asked Questions
What is the average sold price in San Jose?
About $1,349,114 in January 2024, up from about $1,313,604 in August 2023.
Which San Jose zip codes are most and least expensive?
Zip code 95125 had a median list price of about $1,800,000, versus about $632,000 in 95113.

About the author: Manuel Martinez
RealtyTrac contributor
Manuel Martinez is a contributor to RealtyTrac who writes about local housing markets, home buying and real estate investing. He has written for RealtyTrac since 2013, covering city and state market reports, home buying guides and tips, investment financing and strategies for buying and flipping homes.
More in Market Reports
Member Features
Find Real Estate Bargain!
Full foreclosure details
Home value, equity and ownership info
Find homes priced below market
Get full access with a FREE Account
Already a member?