Member Features
Find Real Estate Bargain!
Full foreclosure details
Home value, equity and ownership info
Find homes priced below market
Get full access with a FREE Account
Already a member?
$862,458
Listing Price4beds
2.5baths
1,852sqft
12,594sqft lot
2629 New Banner Ln, Herndon, VA 20171
Member Features
Find Real Estate Bargain!
Full foreclosure details
Home value, equity and ownership info
Find homes priced below market
Get full access with a FREE Account
Already a member?
For Sale
Off Market
Home type
Price / sqft
Year built
Home Details
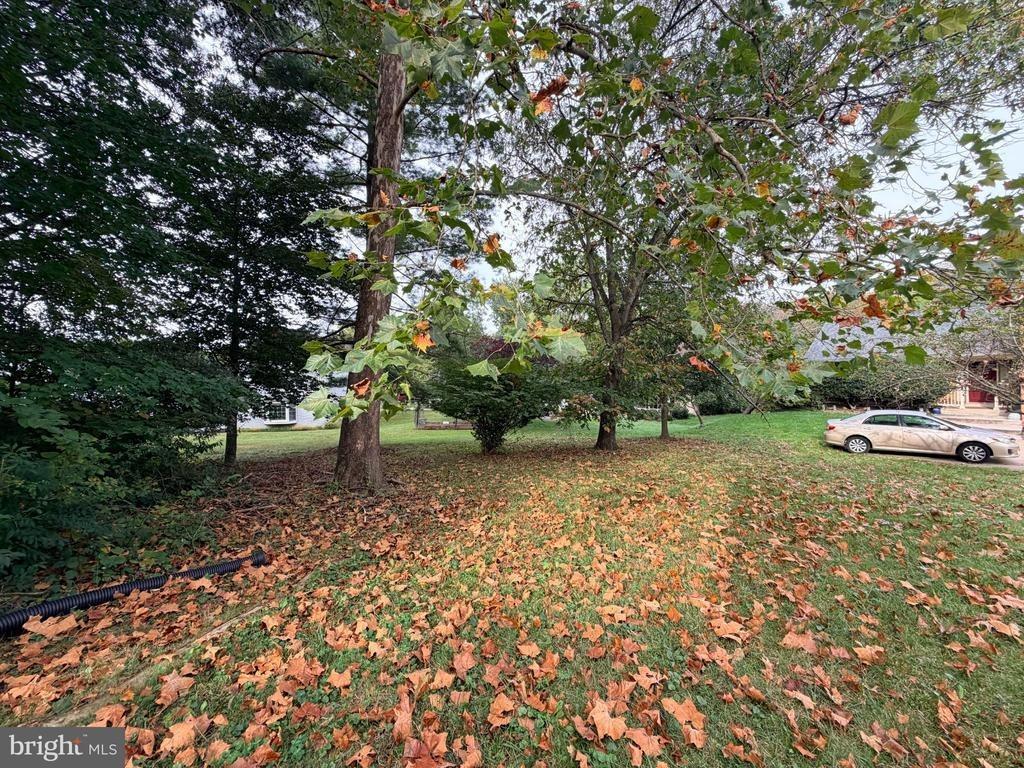
Beautifully updated 4 BR, 2.5 BA Colonial in sought-after Monterey Estates! Features real hardwood floors (2025) on main and upper levels, separate living, dining, and family rooms, updated kitchen, and fully renovated baths (2022). Finished basement with new carpet (2025). Enjoy the deck off the family room overlooking a large yard with gazebo-perfect for entertaining. Recent updates include paint, sliding glass door, and hardwood floors (2025), sprinkler system and landscaping (2024), HVAC, refrigerator, dishwasher, and garage doors (2020), and kitchen, roof, and windows (2015). nnThe home is ideally situated near major commuter routes (Toll Road, 28, Fairfax County Parkway), Dulles Airport and the Silver Line Metro. There is an abundance of dining establishments nearby, as well as plenty of shopping, and parks and recreation to enjoy.nnFLOOR PLANS IN DOCUMENTS. Move-in ready and meticulously maintained!
Interior Details
1852
4
2.5
Has Heating:
Yes
Heating Type:
Heat Pump
Has Cooling:
Yes
Cooling Type:
Central
Has Fuel:
Yes
Fuel Type:
Electric
Has Basement:
No
Basement Type:
Full
Has Flooring:
No
Flooring Type:
Carpet
Has Fireplace:
Yes
Fireplace Type:
N/A
Property Details
12594
Yes
Yes
Type:
Garage, Attached
Location:
N/A
Status:
N/A
Number of Spaces:
2
No
No
No
No
Yes
No
No
Construction Details
Bi-level
Aluminum/vinyl
N/A
N/A
Composition Shingle
Tax History
Year
Amount
Land
Improvement
Percent Change
Assessment
2020
$7,193
$246,000
$294,860
--%
$540,860
2019
$6,254
$236,000
$292,440
--%
$528,440
2018
$5,761
$226,000
$274,960
--%
$500,960
2017
$5,993
$181,000
$215,380
--%
$396,380
2016
$5,941
$221,000
$291,830
--%
$512,830
2014
$5,710
$221,000
$291,830
--%
$512,830
2013
$5,056
$201,000
$256,190
--%
$457,190
2012
$4,304
$191,000
$234,390
--%
$425,390

Average Home Price in 20171
Nearby Properties
Zip Code
Price
Bed
Bath
Sqft
Lot
Sold Date
$860,118
$860,118
3 Beds
2.5 Baths
1,865 Sqft
9,230 Lot (sqft)
Sold 06/22/2026
$811,335
4 Beds
2.5 Baths
1,776 Sqft
12,910 Lot (sqft)
Sold 05/25/2026
$825,000
$825,000
4 Beds
3 Baths
1,776 Sqft
11,260 Lot (sqft)
Sold 10/26/2026
$879,948
$879,948
4 Beds
2.5 Baths
1,800 Sqft
14,455 Lot (sqft)
Sold 10/26/2026
$839,000
$839,000
5 Beds
4 Baths
1,800 Sqft
10,617 Lot (sqft)
Sold 10/26/2026
$861,618
$861,618
3 Beds
3 Baths
1,791 Sqft
9,458 Lot (sqft)
Sold 10/26/2026
$775,000
$775,000
4 Beds
3 Baths
1,754 Sqft
12,150 Lot (sqft)
Sold 10/27/2026
$862,458
$862,458
4 Beds
2.5 Baths
1,852 Sqft
12,594 Lot (sqft)
Sold 10/26/2026