Member Features
Find Real Estate Bargain!
Full foreclosure details
Home value, equity and ownership info
Find homes priced below market
Get full access with a FREE Account
Already a member?
$714,134
Sold Price1beds
1baths
638sqft
85,844sqft lot
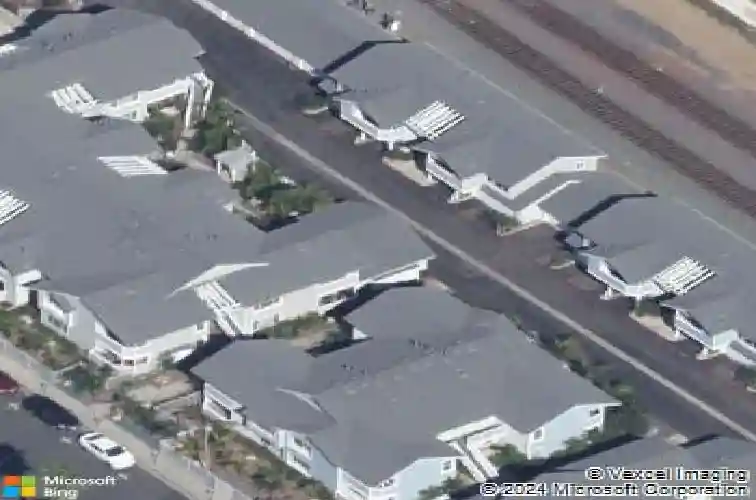
400 N Myers St, Oceanside, CA 92054
Member Features
Find Real Estate Bargain!
Full foreclosure details
Home value, equity and ownership info
Find homes priced below market
Get full access with a FREE Account
Already a member?
Recently Sold
Off Market
Home type
Price / sqft
Year built
Home Details
Interior Details
638
1
1
Has Heating:
No
Heating Type:
N/A
Has Cooling:
No
Cooling Type:
N/A
Has Fuel:
No
Fuel Type:
N/A
Has Basement:
No
Basement Type:
N/A
Has Flooring:
No
Flooring Type:
N/A
Has Fireplace:
Yes
Fireplace Type:
N/A
Property Details
85844
No
No
Type:
Carport (unspecified)
Location:
N/A
Status:
N/A
Number of Spaces:
2
N/A
N/A
N/A
N/A
N/A
N/A
N/A
Construction Details
Condo/apartment
N/A
N/A
N/A
N/A
Tax History
Year
Amount
Land
Improvement
Percent Change
Assessment
2020
$3,499
$247,713
$62,770
--%
$310,483
2019
$3,398
$242,856
$61,540
--%
$304,396
2018
$3,362
$238,095
$60,334
--%
$298,429
2017
$3,301
$233,427
$59,151
--%
$292,578
2016
$3,194
$228,850
$57,992
--%
$286,842
2014
$2,982
$220,998
$56,003
--%
$277,001
2013
$1,575
$63,408
$81,075
--%
$144,483
2012
$1,516
$62,165
$79,486
--%
$141,651

Average Home Price in 92054
Nearby Properties
Zip Code
Price
Bed
Bath
Sqft
Lot
Sold Date
$714,134
$714,134
1 Beds
1 Baths
638 Sqft
85,844 Lot (sqft)
Sold 10/07/2026
Calculators
Mortgage
Mortgage Calculator
Details for 400 N MYERS ST
Property Debt
Foreclosure Contact Details
Similar Homes Nearby
Guides for Myers St

San Diego’s average home values have gone up and down; sale prices per square foot showing a trend. Surrounding cities in southern California reflect varied market health, recent data shows.