Member Features
Find Real Estate Bargain!
Full foreclosure details
Home value, equity and ownership info
Find homes priced below market
Get full access with a FREE Account
Already a member?
$519,000
Listing Price3beds
1baths
1,102sqft
5,026sqft lot
55 Jackson St, Quincy, MA 02169
Member Features
Find Real Estate Bargain!
Full foreclosure details
Home value, equity and ownership info
Find homes priced below market
Get full access with a FREE Account
Already a member?
For Sale
Off Market
Home type
Price / sqft
Year built
Home Details
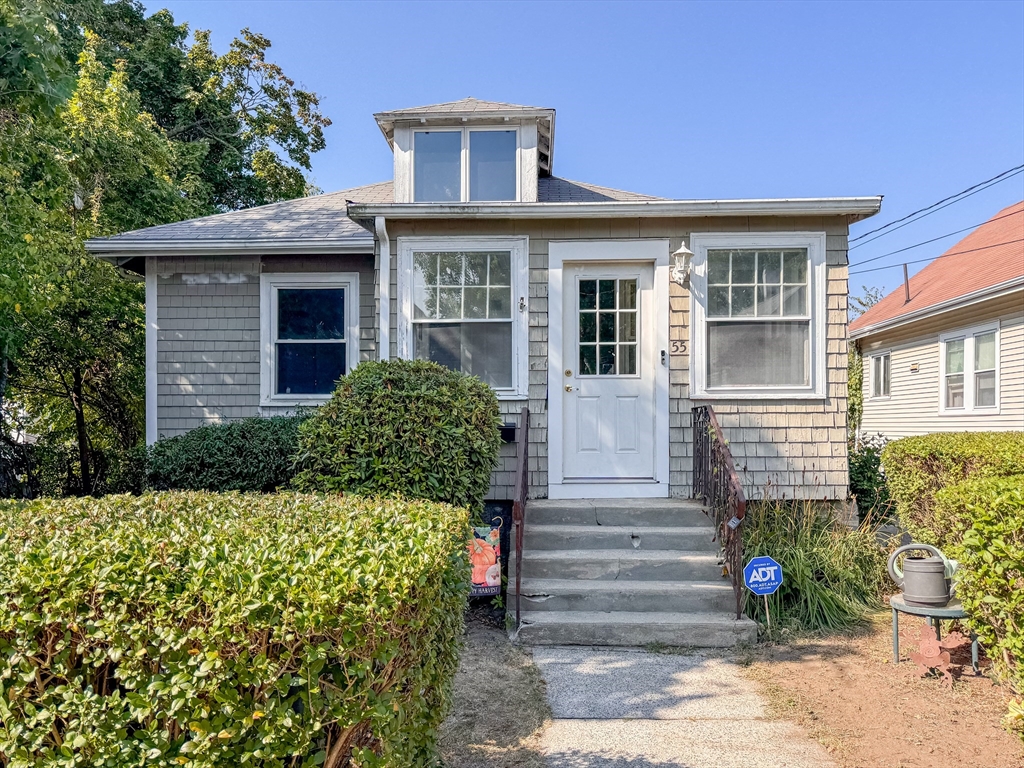
Delightful Bungalow cherished by one family for many generations located on a dead-end street! The first floor features an enclosed sun porch, 2 bedrooms, a sunny kitchen, living room and an additional enclosed back porch! The second-floor features additional living area that has served as a spacious third bedroom. Updates include new flooring in the kitchen, bathroom and one of the bedrooms, energy efficient windows throughout, and a new oil tank (2023). The house has been freshly painted. There is a full basement offering plenty of storage. The roof was installed in 2014. The fenced-in back yard has an idyllic grape trellis and is ready for your garden. Convenient one-car garage. Amazing location, close to Quincy Center's restaurants, shopping, Adams Historic National Park, Wollaston and Mound St Beaches and Quincy College. Commuter's Dream! Only minutes to the highway, all major routes and public transportation. Welcome Home! Offer deadline: 10/06/24 at 5:00 PM
Interior Details
1102
3
1
Has Heating:
Yes
Heating Type:
Forced Air With Air Conditioning
Has Cooling:
No
Cooling Type:
N/A
Has Fuel:
Yes
Fuel Type:
Oil
Has Basement:
No
Basement Type:
Basement (unspecified)
Has Flooring:
No
Flooring Type:
N/A
Has Fireplace:
Yes
Fireplace Type:
N/A
Property Details
5026
No
No
Type:
N/A
Location:
N/A
Status:
N/A
Number of Spaces:
N/A
N/A
N/A
N/A
N/A
N/A
N/A
N/A
Construction Details
Bungalow
Wood Siding
N/A
Gable
Asphalt
Tax History
Year
Amount
Land
Improvement
Percent Change
Assessment
2020
$4,351
$195,000
$155,000
--%
$350,000
2019
$4,133
$184,000
$145,300
--%
$329,300
2018
$4,014
$170,300
$130,600
--%
$300,900
2017
$3,934
$162,200
$115,400
--%
$277,600
2016
$3,601
$141,100
$109,700
--%
$250,800
2014
$3,407
$141,100
$88,200
--%
$229,300
2013
$3,215
$131,800
$89,900
--%
$221,700

Average Home Price in 02169
Nearby Properties
Zip Code
Price
Bed
Bath
Sqft
Lot
Sold Date
$611,630
$611,630
3 Beds
1.5 Baths
1,057 Sqft
7,030 Lot (sqft)
Sold 09/10/2026
$463,541
$463,541
3 Beds
1 Baths
1,024 Sqft
2,954 Lot (sqft)
Sold 06/23/2026
$522,431
$522,431
3 Beds
2 Baths
1,035 Sqft
2,954 Lot (sqft)
Sold 06/23/2026
$379,900
$379,900
2 Beds
2 Baths
1,001 Sqft
1,704 Lot (sqft)
Sold 09/29/2026
$599,900
$599,900
3 Beds
1 Baths
1,188 Sqft
3,650 Lot (sqft)
Sold 11/15/2025
$519,000
$519,000
3 Beds
1 Baths
1,102 Sqft
5,026 Lot (sqft)
Sold 09/29/2026