Member Features
Find Real Estate Bargain!
Full foreclosure details
Home value, equity and ownership info
Find homes priced below market
Get full access with a FREE Account
Already a member?
$399,900
Listing Price3beds
2baths
1,790sqft
26,571sqft lot
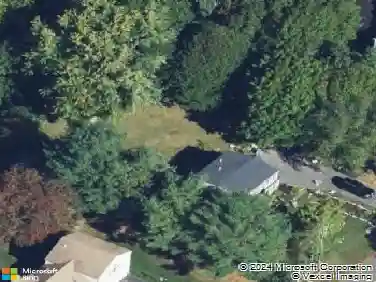
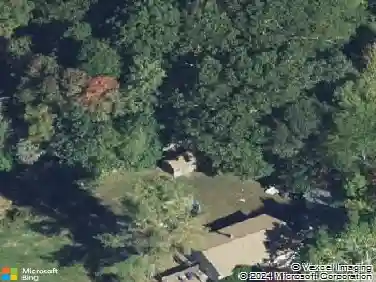
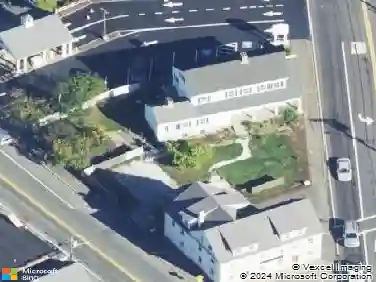
479 Central St, East Bridgewater, MA 02333
Member Features
Find Real Estate Bargain!
Full foreclosure details
Home value, equity and ownership info
Find homes priced below market
Get full access with a FREE Account
Already a member?
For Sale
Off Market
Home type
Price / sqft
Year built
Home Details
Great investment opportunity for contractors and flippers! This antique colonial has tons of potential with a two-car detached garage and a beautiful backyard. Excellent location that is just a short walk to public schools, ball fields, and town common. This property has been used as a preexisting nonconforming two family, prior to zoning. Bring offers!
Interior Details
1790
3
2
Has Heating:
Yes
Heating Type:
Radiant
Has Cooling:
No
Cooling Type:
N/A
Has Fuel:
No
Fuel Type:
N/A
Has Basement:
No
Basement Type:
Full
Has Flooring:
No
Flooring Type:
N/A
Has Fireplace:
Yes
Fireplace Type:
N/A
Property Details
26571
No
No
Type:
Garage, Detached
Location:
N/A
Status:
N/A
Number of Spaces:
0
N/A
N/A
N/A
N/A
N/A
N/A
N/A
Construction Details
Conventional
Wood Siding
N/A
Gable
Asphalt
Tax History
Year
Amount
Land
Improvement
Percent Change
Assessment
2020
$4,845
$145,700
$134,500
--%
$280,200
2019
$4,692
$139,200
$128,000
--%
$267,200
2018
$4,650
$139,200
$119,700
--%
$258,900
2017
$4,553
$132,800
$116,000
--%
$248,800
2016
$4,447
$132,800
$112,100
--%
$244,900
2014
$4,221
$129,100
$113,900
--%
$243,000
2012
$4,076
$142,300
$118,500
--%
$260,800

Average Home Price in 02333
Nearby Properties
Zip Code
Price
Bed
Bath
Sqft
Lot
Sold Date
$687,364
4 Beds
2.5 Baths
1,940 Sqft
39,596 Lot (sqft)
Sold 07/07/2026
$399,900
3 Beds
2 Baths
1,790 Sqft
26,571 Lot (sqft)
Sold 10/27/2026
$634,577
4 Beds
1.5 Baths
1,752 Sqft
52,691 Lot (sqft)
Sold 10/27/2026
$614,900
3 Beds
2 Baths
1,833 Sqft
18,295 Lot (sqft)
Sold 10/27/2026