Member Features
Find Real Estate Bargain!
Full foreclosure details
Home value, equity and ownership info
Find homes priced below market
Get full access with a FREE Account
Already a member?
$681,198
Listing Price2beds
1baths
857sqft
4,903sqft lot
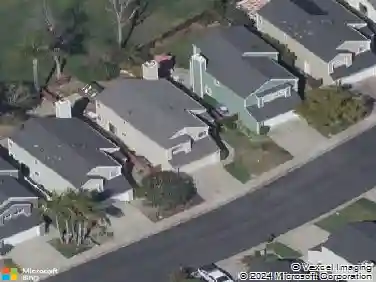
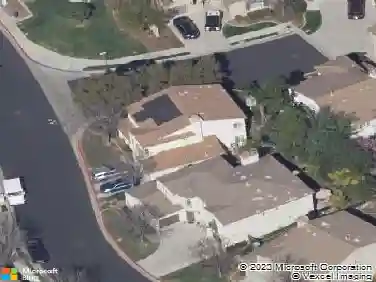
831 Bayberry Ct, San Marcos, CA 92069
Member Features
Find Real Estate Bargain!
Full foreclosure details
Home value, equity and ownership info
Find homes priced below market
Get full access with a FREE Account
Already a member?
For Sale
Off Market
Home type
Price / sqft
Year built
Home Details
Seller entertaining offers between $649,900-699,900 Tons of potential here to make this your home. One of the lowest price entry level homes in North San Diego. This single story home located in sought out area of San Marcos. A Standout feature is the generous gated side yard, providing valuable space for additional vehicles, recreational toys, or construction equipment. Home offers a private backyard with large side yards. The home also features a private low maintenance yard, attached garage with additional driveway parking. Low HOA Conveniently located walking distance to Richland Elem. School, close proximity to Cal State SM. Several hiking and walking areas nearby. Solar Panels and great curb appeal
Interior Details
857
2
1
Has Heating:
Yes
Heating Type:
Forced Air With Air Conditioning
Has Cooling:
Yes
Cooling Type:
Central
Has Fuel:
No
Fuel Type:
N/A
Has Basement:
No
Basement Type:
N/A
Has Flooring:
No
Flooring Type:
N/A
Has Fireplace:
Yes
Fireplace Type:
N/A
Property Details
4903
No
No
Type:
Garage, Attached
Location:
N/A
Status:
N/A
Number of Spaces:
1
N/A
N/A
N/A
N/A
N/A
N/A
N/A
Construction Details
Conventional
N/A
N/A
N/A
N/A
Tax History
Year
Amount
Land
Improvement
Percent Change
Assessment
2020
$2,758
$164,789
$81,039
--%
$245,828
2019
$2,727
$161,558
$79,450
--%
$241,008
2018
$2,641
$158,391
$77,893
--%
$236,284
2017
$2,589
$155,286
$76,366
--%
$231,652
2016
$2,548
$152,242
$74,869
--%
$227,111
2014
$2,454
$147,019
$72,301
--%
$219,320
2013
$2,409
$146,355
$71,975
--%
$218,330
2012
$2,319
$143,486
$70,564
--%
$214,050

Average Home Price in 92069
Nearby Properties
Zip Code
Price
Bed
Bath
Sqft
Lot
Sold Date
$747,000
2 Beds
1 Baths
844 Sqft
5,643 Lot (sqft)
Sold 09/01/2026
$638,654
$638,654
2 Beds
2 Baths
937 Sqft
4,499 Lot (sqft)
Sold 07/28/2026
$750,000
3 Beds
1 Baths
844 Sqft
5,163 Lot (sqft)
Sold 10/27/2026
$775,000
$775,000
2 Beds
2 Baths
937 Sqft
4,819 Lot (sqft)
Sold 10/26/2026
$532,386
2 Beds
1 Baths
844 Sqft
4,618 Lot (sqft)
Sold 10/13/2026
$541,346
4 Beds
2 Baths
844 Sqft
6,094 Lot (sqft)
Sold 10/27/2026
$681,198
2 Beds
1 Baths
857 Sqft
4,903 Lot (sqft)
Sold 10/27/2026
$731,529
2 Beds
2 Baths
952 Sqft
4,996 Lot (sqft)
Sold 10/27/2026
$553,316
2 Beds
1 Baths
844 Sqft
4,823 Lot (sqft)
Sold 10/27/2026
Calculators
Mortgage
Mortgage Calculator
Details for 831 BAYBERRY CT
Property Debt
Foreclosure Contact Details
Similar Homes Nearby

Guides for Bayberry Ct

San Diego’s average home values have gone up and down; sale prices per square foot showing a trend. Surrounding cities in southern California reflect varied market health, recent data shows.