

Garland Shows Steady Growth and Stability from April 2023 to February 2024
The Garland real estate market shows signs of steady growth and stability, with average property values and per square foot prices seeing modest increases.

Key Takeaways
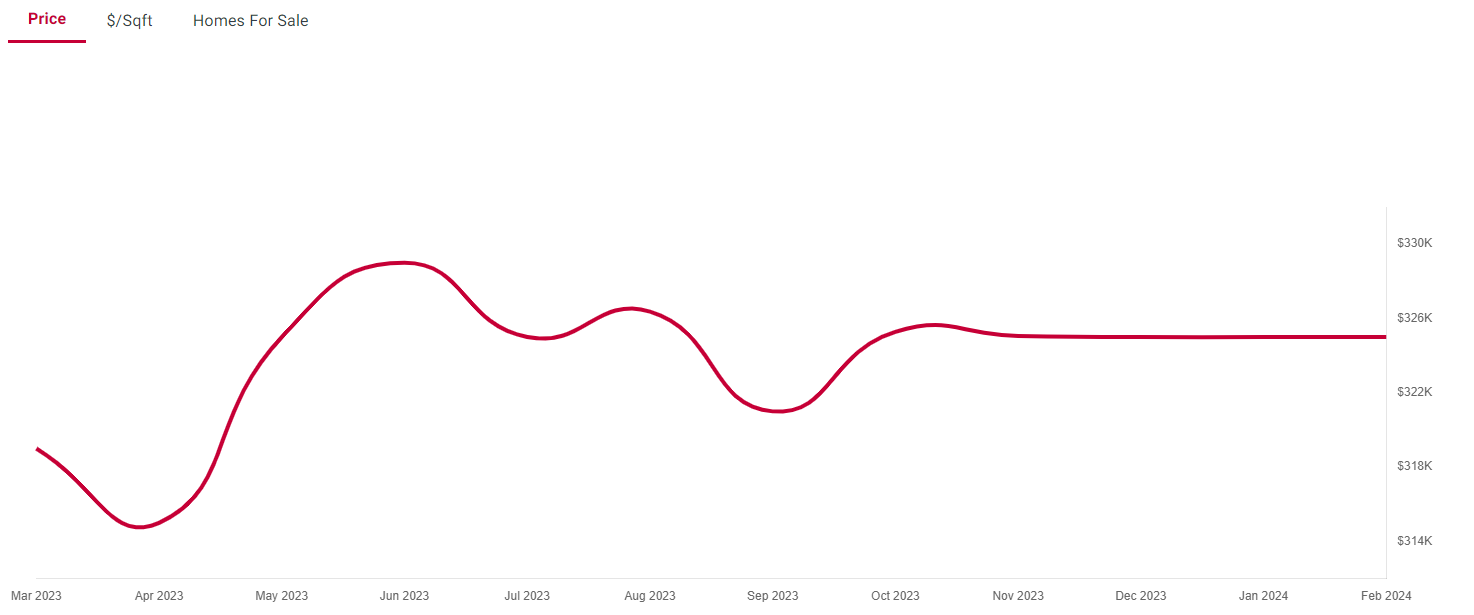
- Garland's average property value rose from $315,000 to $325,000 between April 2023 and February 2024.
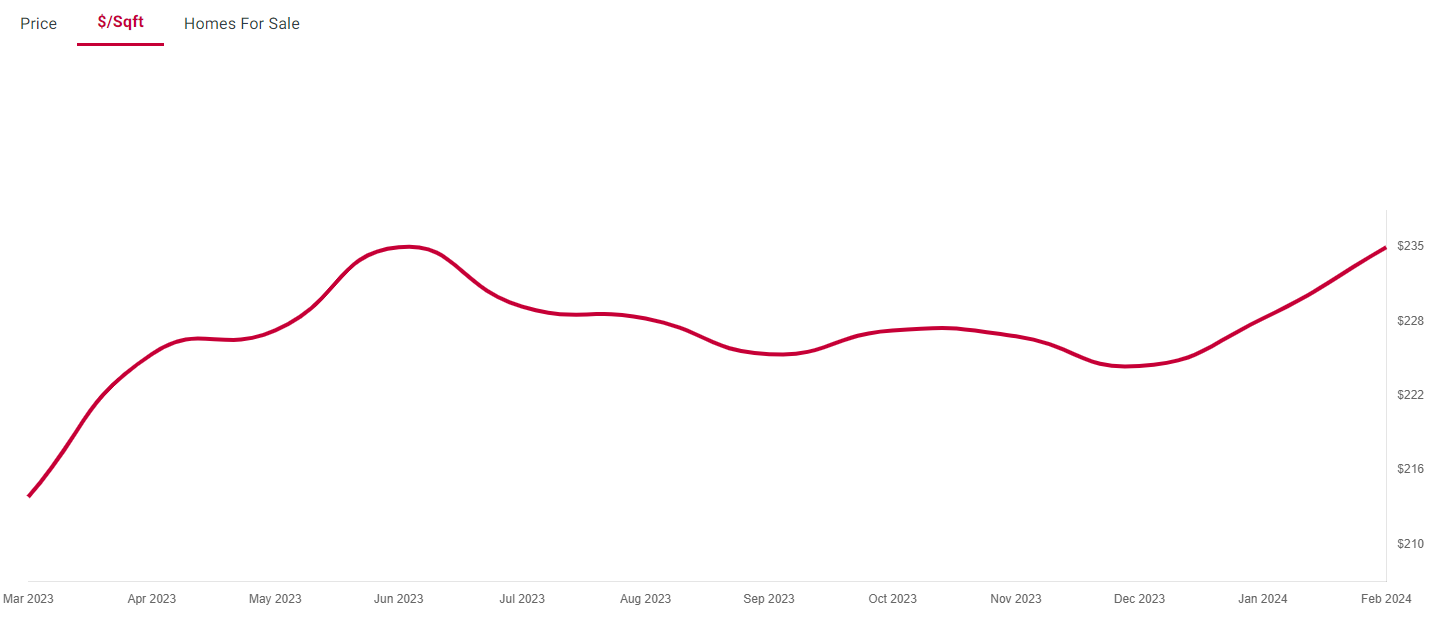
- Price per square foot increased from $183 to $190 over the same period.
- Average listing value was $322,000, versus a recent average sale price of $166,000.
- Foreclosures and auctions are a minor part of Garland's market.
- Nearby Sunnyvale is pricier, with values from $649,000 to $879,000.
Overview of the Garland Real Estate Market
The real estate market in Garland, Texas exhibits signs of stability and gradual growth, reflecting a healthy environment for both buyers and sellers. Over a period starting from April 2023 to February 2024, the average property value in Garland saw a modest uptick from $315,000 to $325,000. The average price per square foot value the same timeframe saw a slight growth trend, increasing from $183 to $190. This is indicative of a consistent appreciation of property value space in Garland. Simultaneously, the average sale price per square foot also rose, indicating that the market is responding positively with buyers willing to spend more for the available property space over the reviewed period.
In comparison with nearby locales, Garland’s property values show notable differences. For example, neighboring cities such as Rowlett and Sachse present higher average property values, suggesting diverse market dynamics possibly influenced by the type of housing and community attributes. Particularly striking is Sunnyvale, which maintains significantly higher property values that range from $649,000 to $879,000, showcasing it as an upscale market.
Good news for those concerned about market health – Garland foreclosures and auctions form a minor segment of market activity, insinuating a robust real estate landscape with limited distressed properties. Additionally, the active market’s average sale price stands at $166,000, somewhat lower than the overall average values observed. In terms of sales, the most recent average sale prices recorded over the last six months show at $166,000, a figure lower than the average value of properties currently listed for sale at $322,000, potentially pointing to a preference or higher demand for properties that may be less expensive for various reasons, such as size or location.
Inside Garland’s Market: Neighborhood Diversification
Taking a closer look inside Garland uncovers further intricacies of the market. Each zip code within the city brings its own flavor to the table, with differentiating factors such as proximity to amenities, property sizes, and community offerings. The zip code 75044, for instance, boasts higher average list prices and values as compared to 75042, revealing micro-markets within Garland that cater to a variety of resident needs and investment levels.
The incremental rise in values, both on average property and per square foot baselines, suggests a conservative yet optimistic growth pattern for the city. This consistency benefits those looking to invest in the market, with evidence of returns on investment through increased value per square foot. Potential homeowners and investors can gauge the market’s potential return by observing these trends, making informed decisions based on the property space appreciation.
Particularly interesting is the contrast between the recent average sale prices and the average values of properties currently listed for sale. Sitting at the lower end, recent sale prices being around $166,000 indicates that what has been moving off the market tends to be more affordable or possibly in locations less sought after. In contrast, the higher average list price of properties currently on the market at $322,000 suggests that homes currently for sale may be larger, updated, or in more coveted locales within Garland.
Comparative Analysis – Garland and its Neighbors
While Garland sustains steady growth, areas such as Richardson command high per square foot values, peaking at $235, which may reflect a smaller and denser housing market or perhaps indicate a high demand due to location desirability.
When positioned against the backdrop of these neighboring areas, Garland’s real estate market is perceived as stable, with the promise of gentle appreciation signifying a lower risk for drastic dips in property values. This stability is attractive to long-term residential buyers as well as to investors seeking to leverage the gradual increase in per square foot value.
- Dallas Ends 2023 on Strong Note: Surge in Home Prices and Robust Market Activity Reflect Dynamic Growth
- Irving, TX Real Estate Market Sees Varying Dynamics Amid Fluctuating Property Values in Early 2024
- El Paso Property Values Grow 5% – May 2024 Report
- Dallas Housing Values Climb Despite Market Volatility, April 2024 Snapshot Reveals
Garland’s real estate climate contrasts starkly with Sunnyvale, which evidently caters to a more affluent demographic, exhibiting property values that dwarfs that of Garland. Understanding these variations becomes critical for potential buyers and investors as they navigate where to allocate their resources for maximum benefit. Similarly, those selling real estate within Garland can target their sales strategies based on these locational insights, taking advantage of the demarcated market cultures across different zip codes.
The juxtaposition of Garland’s asset stability against the diversity of the surrounding cities presents a tapestry of opportunities for real estate activities. From entry-level properties to more upscale investments, this region exhibits a collection of markets that cater to the full spectrum of buyer and investor interests.
Frequently Asked Questions
What is the average home value in Garland, TX?
The average property value was $325,000 in February 2024, up from $315,000 in April 2023.
Are home prices rising in Garland?
Modestly. Value per square foot rose from $183 to $190 between April 2023 and February 2024.

About the author: Manuel Martinez
RealtyTrac contributor
Manuel Martinez is a contributor to RealtyTrac who writes about local housing markets, home buying and real estate investing. He has written for RealtyTrac since 2013, covering city and state market reports, home buying guides and tips, investment financing and strategies for buying and flipping homes.
More in Market Reports
Member Features
Find Real Estate Bargain!
Full foreclosure details
Home value, equity and ownership info
Find homes priced below market
Get full access with a FREE Account
Already a member?
