Member Features
Find Real Estate Bargain!
Full foreclosure details
Home value, equity and ownership info
Find homes priced below market
Get full access with a FREE Account
Already a member?
$914,947
Listing Price4beds
4.5baths
4,007sqft
9,100sqft lot
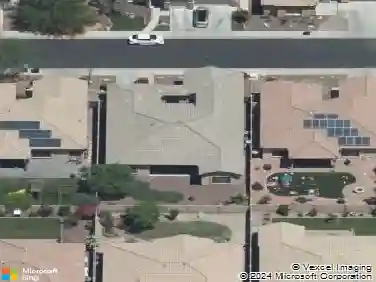
1806 W Yellow Bird Ln, Phoenix, AZ 85085
Member Features
Find Real Estate Bargain!
Full foreclosure details
Home value, equity and ownership info
Find homes priced below market
Get full access with a FREE Account
Already a member?
For Sale
Home type
Price / sqft
Year built
Home Details
NEW AC units installed in 2026 and 2023. Energy efficient with solar, keeping peak summer cooling costs around $266 per month for a home of this size. Located in Fireside Norterra with access to beautiful community amenities including huge parks and play areas. Desirable layout with primary suite downstairs and a spacious upstairs ensuite bedroom that can serve as a secondary primary. Bright, open floor plan with wood look tile and flexible living spaces including a large office or bonus room ideal for a gym or media. Gourmet kitchen with granite counters, mosaic backsplash, gas cooktop, pantry and oversized island. APS bills average as low as $32 from October through May and approximately $266 at peak summer. Recent upgrades include new HVAC systems installed in May 2026 and 2023. Exterior painted October 2020. Dishwasher replaced April 2023. Pool pump replaced July 2024. New water softener installed June 2025. Home includes fire sprinklers throughout. Solar lease began May 2013 with a 20 year term, with approximately 8 years remaining.
Interior Details
4007
4
4.5
Has Heating:
Yes
Heating Type:
Forced Air With Air Conditioning
Has Cooling:
Yes
Cooling Type:
Refrigerator
Has Fuel:
No
Fuel Type:
N/A
Has Basement:
No
Basement Type:
N/A
Has Flooring:
No
Flooring Type:
N/A
Has Fireplace:
Yes
Fireplace Type:
N/A
Property Details
9100
Yes
Yes
Type:
N/A
Location:
N/A
Status:
N/A
Number of Spaces:
N/A
No
No
No
No
No
No
No
Construction Details
N/A
Wood
N/A
N/A
Concrete
Tax History
Year
Amount
Land
Improvement
Percent Change
Assessment
2020
$5,103
$9,200
$36,810
--%
$46,010
2019
$5,043
$9,330
$37,320
--%
$46,650
2018
$4,866
$9,170
$36,710
--%
$45,880
2017
$4,689
$8,100
$32,400
--%
$40,500
2016
$4,423
$7,720
$30,890
--%
$38,610
2014
$4,000
$7,780
$31,140
--%
$38,920
2013
$3,553
$6,720
$26,910
--%
$33,630
2012
$3,259
$6,110
$24,460
--%
$30,570

Average Home Price in 85085
Nearby Properties
Zip Code
Price
Bed
Bath
Sqft
Lot
Sold Date
$847,671
4 Beds
4.5 Baths
4,007 Sqft
8,400 Lot (sqft)
Sold 09/30/2026
$1,308,526
$1,308,526
4 Beds
4.5 Baths
4,123 Sqft
15,101 Lot (sqft)
Sold 09/23/2026
$1,343,345
$1,343,345
-- Beds
5.5 Baths
4,287 Sqft
18,840 Lot (sqft)
Sold 05/13/2026
$875,000
6 Beds
4 Baths
3,659 Sqft
7,534 Lot (sqft)
Sold 10/26/2026
$862,145
$862,145
5 Beds
4.5 Baths
4,464 Sqft
11,585 Lot (sqft)
Sold 10/27/2026
$980,656
$980,656
4 Beds
4.5 Baths
4,008 Sqft
8,750 Lot (sqft)
Sold 10/26/2026
$950,000
$950,000
4 Beds
4.5 Baths
4,007 Sqft
10,383 Lot (sqft)
Sold 10/26/2026
$914,947
4 Beds
4.5 Baths
4,007 Sqft
9,100 Lot (sqft)
Sold 10/26/2026
$821,188
$821,188
-- Beds
4.5 Baths
4,014 Sqft
10,297 Lot (sqft)
Sold 10/26/2026