Member Features
Find Real Estate Bargain!
Full foreclosure details
Home value, equity and ownership info
Find homes priced below market
Get full access with a FREE Account
Already a member?
$615,000
Listing Price4beds
2baths
1,762sqft
6,000sqft lot
265 W Windsor Pkwy, Oceanside, NY 11572
Member Features
Find Real Estate Bargain!
Full foreclosure details
Home value, equity and ownership info
Find homes priced below market
Get full access with a FREE Account
Already a member?
For Sale
Off Market
Home type
Price / sqft
Year built
Home Details
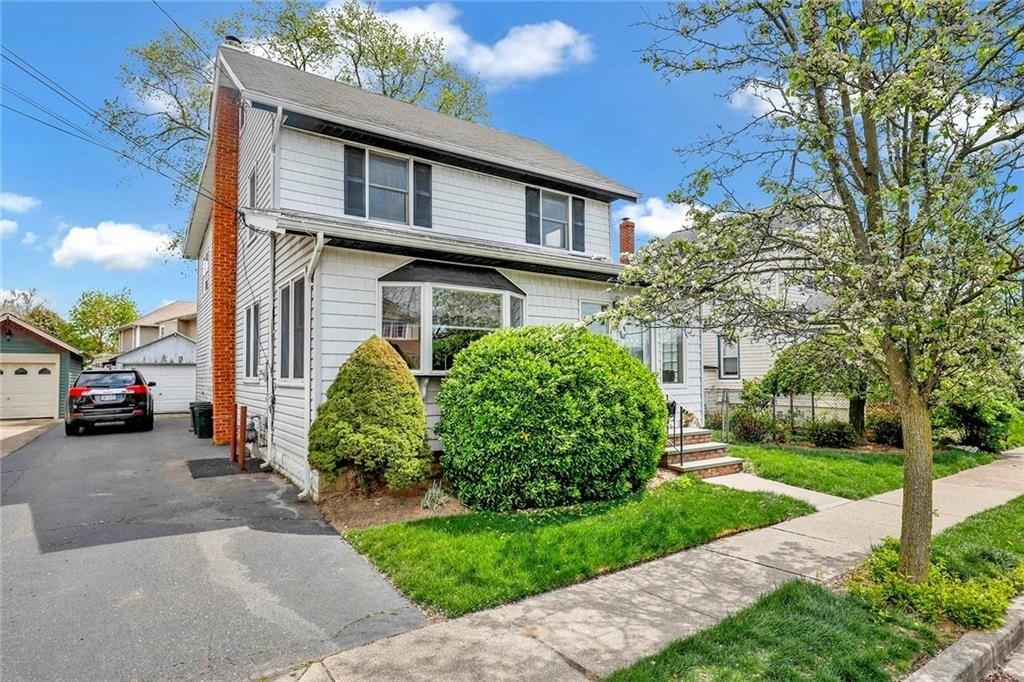
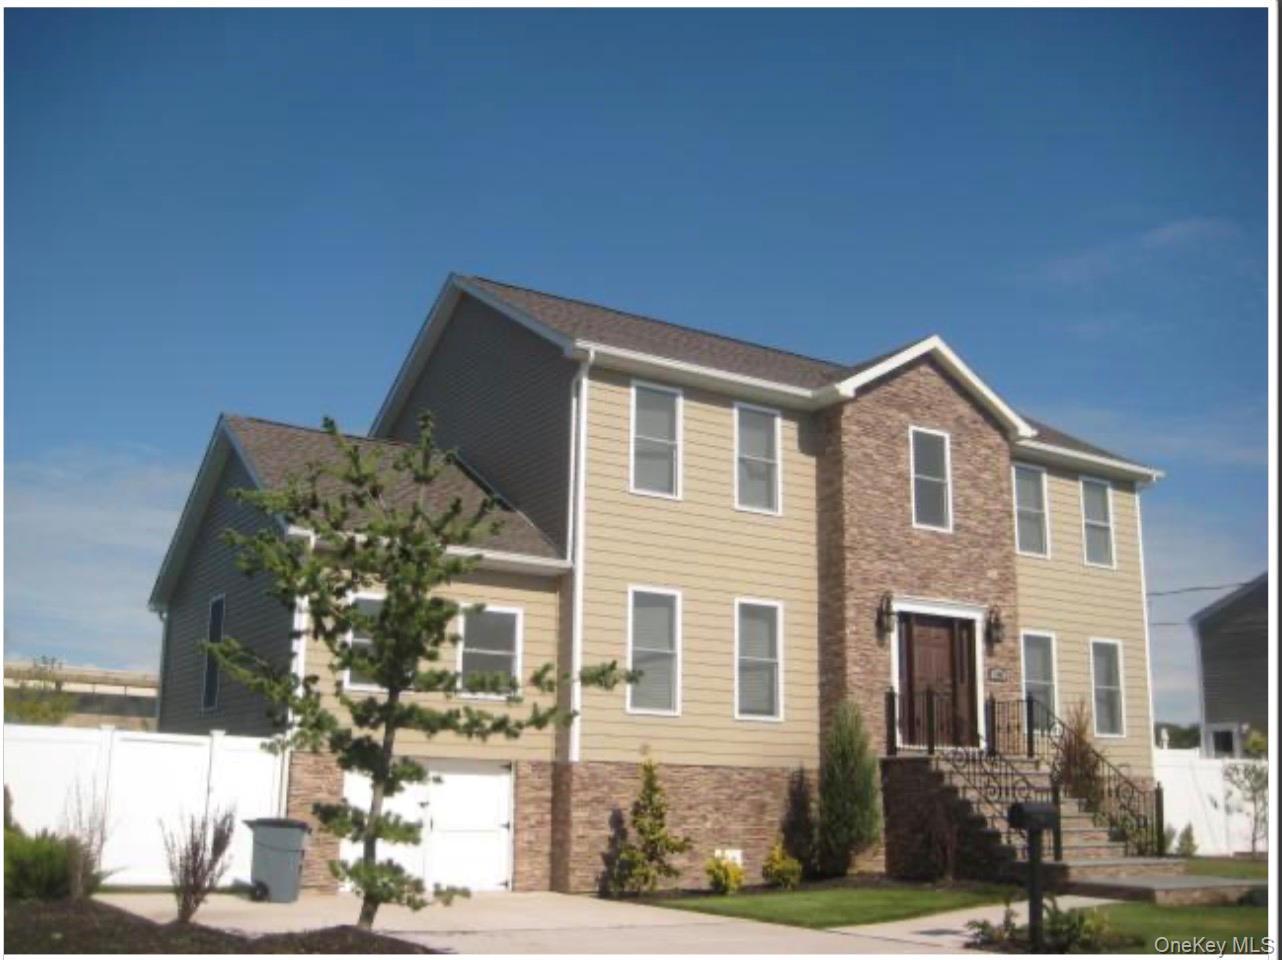
Welcome to 265 West Windsor Parkway, a beautifully updated Expanded Cape nestled in the heart of Oceanside. The main floor invites you in with a spacious living room and a versatile den, complemented by a dedicated laundry/utility room for ultimate convenience. The heart of the home is the updated eat-in kitchen, featuring rich maple cabinetry, sleek countertops, and stainless steel appliances. From here, step out to your massive, private vinyl-fenced backyard—an entertainer's dream with a large cement patio perfect for summer gatherings.This level also offers two comfortable bedrooms and a full bathroom. Retreat upstairs to find two additional king-sized bedrooms boasting expansive closet space and a second full bath. Complete with gas cooking, siding, and an architectural shingle roof, this home is truly move-in ready. Excellent commuter location close to the LIRR. Bonus: Includes a $1,233 transferable flood insurance policy!
Interior Details
1762
4
2
Has Heating:
Yes
Heating Type:
Central
Has Cooling:
Yes
Cooling Type:
Central
Has Fuel:
Yes
Fuel Type:
Oil
Has Basement:
No
Basement Type:
No Basement
Has Flooring:
No
Flooring Type:
N/A
Has Fireplace:
Yes
Fireplace Type:
N/A
Property Details
6000
Yes
Yes
Type:
N/A
Location:
N/A
Status:
N/A
Number of Spaces:
N/A
N/A
N/A
N/A
N/A
N/A
N/A
N/A
Construction Details
Cape Cod
Aluminum/vinyl
N/A
N/A
Other (not Classified)
Tax History
Year
Amount
Land
Improvement
Percent Change
Assessment
2019
$6,202
$198
$278
--%
$476
2019
$6,202
$589
$1
--%
$590
2018
$6,332
$629
$1
--%
$630
2016
$6,659
$667
$2
--%
$669
2016
$6,659
$667
$68
--%
$735
2015
$6,851
$667
$219
--%
$886
2014
$8,183
$667
$219
--%
$886
2012
$6,638
$718
$236
--%
$954

Average Home Price in 11572
Nearby Properties
Zip Code
Price
Bed
Bath
Sqft
Lot
Sold Date
$716,189
$716,189
-- Beds
2 Baths
1,596 Sqft
10,080 Lot (sqft)
Sold 09/25/2026
$759,000
3 Beds
2 Baths
1,558 Sqft
6,000 Lot (sqft)
Sold 09/29/2026
$1,399,999
$1,399,999
5 Beds
4 Baths
1,754 Sqft
6,500 Lot (sqft)
Sold 09/29/2026
$803,534
$803,534
-- Beds
2.5 Baths
1,662 Sqft
4,350 Lot (sqft)
Sold NaN/NaN/NaN
$768,034
$768,034
-- Beds
2.5 Baths
1,722 Sqft
6,000 Lot (sqft)
Sold 10/26/2026
$786,800
$786,800
-- Beds
1.5 Baths
1,616 Sqft
5,000 Lot (sqft)
Sold 10/26/2026
$850,000
-- Beds
2 Baths
1,517 Sqft
4,000 Lot (sqft)
Sold 10/27/2026
$749,990
$749,990
3 Beds
2 Baths
1,760 Sqft
9,850 Lot (sqft)
Sold 10/26/2026
$775,000
3 Beds
2 Baths
1,932 Sqft
6,000 Lot (sqft)
Sold 09/29/2026