

Member Features
Find Real Estate Bargain!
Full foreclosure details
Home value, equity and ownership info
Find homes priced below market
Get full access with a FREE Account
Already a member?
$279,900
Listing Price--beds
--baths
1,011sqft
1,011sqft lot
697 Winding Stream Way, Odenton, MD 21113
Member Features
Find Real Estate Bargain!
Full foreclosure details
Home value, equity and ownership info
Find homes priced below market
Get full access with a FREE Account
Already a member?
For Sale
Off Market
Home type
Price / sqft
Year built
Home Details
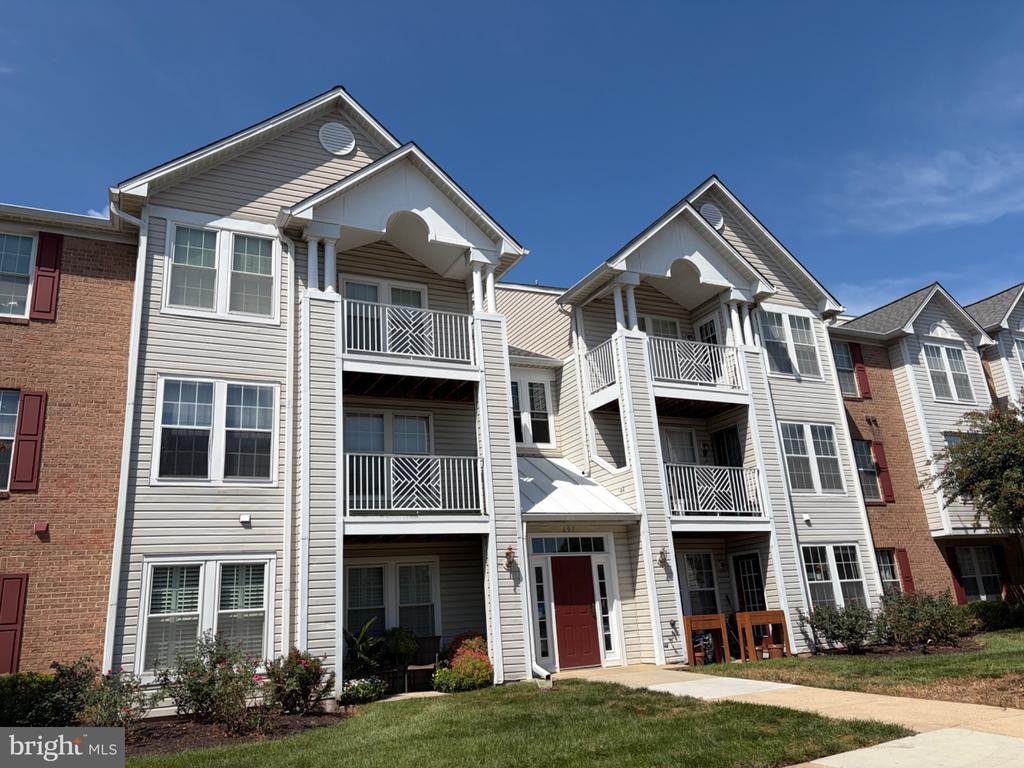
Living in Piney Orchard feels like vacation every single day. Very affordable first floor unit is available for a sale! Incredible price and value!!! New LVP and carpet. Open floor plan offers kitchen open to dedicated dining space and living room. New kitchen countertops and sink. Plenty of cabinets and counter space. Breakfast bar. Pantry. Dedicated dining area. Patio off the kitchen. Spacious primary bedroom with expanded walk in closet and build ins. 2nd bedroom. Spacious full bath. Laundry room. Piney Orchard is beautifully landscaped community that offers incredible amenities - indoor pool, spa, fitness room, community center, community lake, walking trails, playgrounds, tennis courts, multiple outdoor pools. Also conveniently located near Ft Meade, NSA, National Business Park. Easy commute to Washington DC/Baltimore/Annapolis. Near several shopping centers (Wegmans just few min away), plenty of dining and entertaining options. Move in ready!!!
Interior Details
1011
N/A
N/A
Has Heating:
Yes
Heating Type:
Yes
Has Cooling:
Yes
Cooling Type:
N/A
Has Fuel:
No
Fuel Type:
N/A
Has Basement:
No
Basement Type:
N/A
Has Flooring:
No
Flooring Type:
N/A
Has Fireplace:
Yes
Fireplace Type:
N/A
Property Details
1011
Yes
Yes
Type:
N/A
Location:
N/A
Status:
N/A
Number of Spaces:
N/A
N/A
N/A
N/A
N/A
N/A
N/A
N/A
Construction Details
Condo/apartment
N/A
N/A
N/A
N/A
Tax History
Year
Amount
Land
Improvement
Percent Change
Assessment
2021
$1,777
$0
$0
--%
$168,433
2020
$1,708
$80,800
$80,900
--%
$161,700
2019
$1,654
$80,800
$80,900
--%
$161,700
2018
$1,662
$80,800
$80,900
--%
$161,700
2017
$1,728
$83,400
$83,400
--%
$166,800
2015
$1,771
$83,400
$83,400
--%
$166,800
2014
$1,887
$88,400
$88,500
--%
$176,900
2012
$1,862
$0
$0
--%
$176,900

Average Home Price in 21113
Nearby Properties
Zip Code
Price
Bed
Bath
Sqft
Lot
Sold Date
$297,375
-- Beds
-- Baths
1,036 Sqft
1,036 Lot (sqft)
Sold 10/08/2026
$300,851
-- Beds
-- Baths
1,036 Sqft
1,036 Lot (sqft)
Sold 05/29/2026
$317,000
-- Beds
-- Baths
1,037 Sqft
1,037 Lot (sqft)
Sold 10/26/2026
$322,000
-- Beds
-- Baths
1,036 Sqft
1,036 Lot (sqft)
Sold 10/26/2026
$269,900
-- Beds
-- Baths
1,013 Sqft
1,013 Lot (sqft)
Sold 10/13/2026
$349,900
-- Beds
2 Baths
1,103 Sqft
1,103 Lot (sqft)
Sold 10/26/2026
$279,900
-- Beds
-- Baths
1,011 Sqft
1,011 Lot (sqft)
Sold 10/27/2026
$330,000
-- Beds
-- Baths
1,036 Sqft
1,036 Lot (sqft)
Sold 10/26/2026
$265,000
-- Beds
2 Baths
1,033 Sqft
1,033 Lot (sqft)
Sold 10/13/2026