Member Features
Find Real Estate Bargain!
Full foreclosure details
Home value, equity and ownership info
Find homes priced below market
Get full access with a FREE Account
Already a member?
$662,319
Listing Price--beds
--baths
3,528sqft
10,629sqft lot
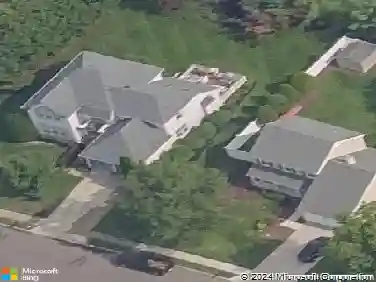
39 Tynemouth Dr, Lumberton, NJ 08048
Member Features
Find Real Estate Bargain!
Full foreclosure details
Home value, equity and ownership info
Find homes priced below market
Get full access with a FREE Account
Already a member?
For Sale
Home type
Price / sqft
Year built
Home Details
Interior Details
3528
N/A
N/A
Has Heating:
No
Heating Type:
N/A
Has Cooling:
No
Cooling Type:
N/A
Has Fuel:
No
Fuel Type:
N/A
Has Basement:
No
Basement Type:
N/A
Has Flooring:
No
Flooring Type:
N/A
Has Fireplace:
Yes
Fireplace Type:
N/A
Property Details
10629
No
No
Type:
N/A
Location:
N/A
Status:
N/A
Number of Spaces:
N/A
N/A
N/A
N/A
N/A
N/A
N/A
N/A
Construction Details
N/A
N/A
N/A
N/A
N/A
Tax History
Year
Amount
Land
Improvement
Percent Change
Assessment
2020
$9,426
$95,200
$294,800
--%
$390,000
2019
$9,321
$95,200
$294,800
--%
$390,000
2018
$9,180
$95,200
$294,800
--%
$390,000
2017
$9,009
$95,200
$294,800
--%
$390,000
2016
$9,379
$95,200
$319,800
--%
$415,000
2014
$9,678
$95,200
$353,300
--%
$448,500
2013
$9,683
$95,200
$353,300
--%
$448,500
2012
$9,620
$95,200
$353,300
--%
$448,500

Average Home Price in 08048
Nearby Properties
Zip Code
Price
Bed
Bath
Sqft
Lot
Sold Date
$546,126
-- Beds
-- Baths
3,360 Sqft
435,600 Lot (sqft)
Sold 10/07/2026
$662,319
-- Beds
-- Baths
3,528 Sqft
10,629 Lot (sqft)
Sold 10/13/2026
$695,000
4 Beds
3 Baths
3,024 Sqft
11,435 Lot (sqft)
Sold 10/13/2026
$908,695
-- Beds
-- Baths
3,481 Sqft
25,265 Lot (sqft)
Sold 10/13/2026
$824,900
5 Beds
4 Baths
3,934 Sqft
28,366 Lot (sqft)
Sold 10/13/2026
$769,987
-- Beds
-- Baths
3,020 Sqft
9,222 Lot (sqft)
Sold 10/13/2026
$745,000
5 Beds
4 Baths
3,204 Sqft
13,599 Lot (sqft)
Sold 10/13/2026
$678,000
$678,000
5 Beds
4 Baths
3,064 Sqft
13,016 Lot (sqft)
Sold 09/29/2026
$743,771
-- Beds
-- Baths
3,847 Sqft
12,781 Lot (sqft)
Sold NaN/NaN/NaN