Member Features
Find Real Estate Bargain!
Full foreclosure details
Home value, equity and ownership info
Find homes priced below market
Get full access with a FREE Account
Already a member?
$1,248,393
Sold Price--beds
3.5baths
4,143sqft
22,216sqft lot
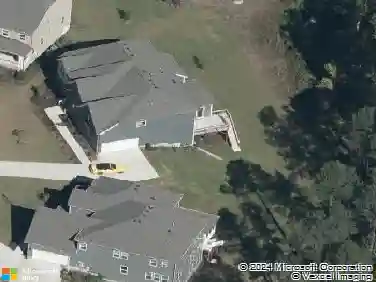
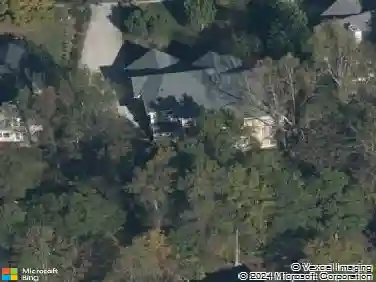
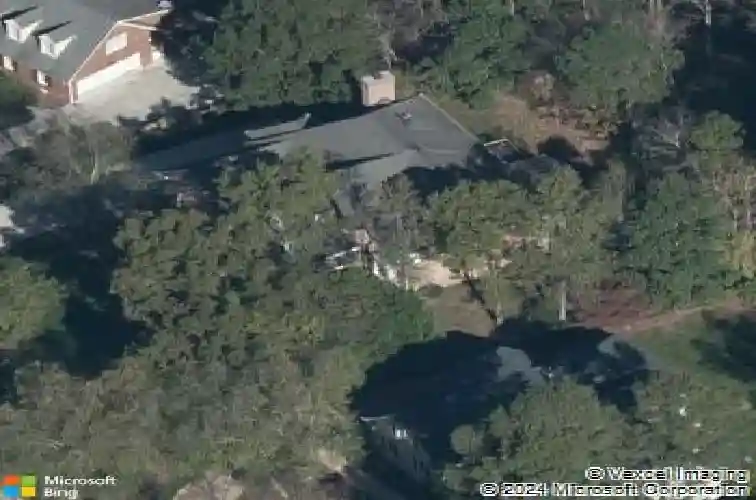
404 Tynemouth Dr, Cary, NC 27513
Member Features
Find Real Estate Bargain!
Full foreclosure details
Home value, equity and ownership info
Find homes priced below market
Get full access with a FREE Account
Already a member?
Recently Sold
Off Market
Home type
Price / sqft
Year built
Home Details
Interior Details
4143
N/A
3.5
Has Heating:
Yes
Heating Type:
Forced Air With Air Conditioning
Has Cooling:
Yes
Cooling Type:
Central
Has Fuel:
Yes
Fuel Type:
Gas
Has Basement:
No
Basement Type:
No Basement
Has Flooring:
No
Flooring Type:
N/A
Has Fireplace:
Yes
Fireplace Type:
N/A
Property Details
22216
Yes
Yes
Type:
N/A
Location:
N/A
Status:
N/A
Number of Spaces:
N/A
No
No
No
No
Yes
No
No
Construction Details
Conventional
Brick
N/A
Hip
N/A
Tax History
Year
Amount
Land
Improvement
Percent Change
Assessment
2020
$6,377
$140,000
$529,251
--%
$669,251
2020
$6,377
$140,000
$529,251
--%
$669,251
2019
$6,391
$140,000
$455,065
--%
$595,065
2018
$5,996
$140,000
$455,065
--%
$595,065
2017
$5,762
$140,000
$455,065
--%
$595,065
2015
$6,305
$160,000
$478,433
--%
$638,433
2014
$5,944
$160,000
$478,433
--%
$638,433
2013
$5,663
$160,000
$478,433
--%
$638,433
2012
$5,536
$160,000
$478,433
--%
$638,433

Average Home Price in 27513
Nearby Properties
Zip Code
Price
Bed
Bath
Sqft
Lot
Sold Date
$953,729
-- Beds
3.5 Baths
3,720 Sqft
8,712 Lot (sqft)
Sold 10/07/2026
$1,248,393
$1,248,393
-- Beds
3.5 Baths
4,143 Sqft
22,216 Lot (sqft)
Sold 09/01/2026
$1,221,244
$1,221,244
-- Beds
3 Baths
4,124 Sqft
36,155 Lot (sqft)
Sold 08/18/2026
$1,260,794
$1,260,794
-- Beds
3 Baths
4,714 Sqft
21,780 Lot (sqft)
Sold 10/26/2026
$1,200,000
$1,200,000
5 Beds
5 Baths
4,039 Sqft
19,602 Lot (sqft)
Sold 10/26/2026
$1,200,000
$1,200,000
-- Beds
3.5 Baths
4,415 Sqft
19,166 Lot (sqft)
Sold 10/26/2026