Member Features
Find Real Estate Bargain!
Full foreclosure details
Home value, equity and ownership info
Find homes priced below market
Get full access with a FREE Account
Already a member?
$809,000
Listing Price4beds
3baths
1,456sqft
11,326sqft lot
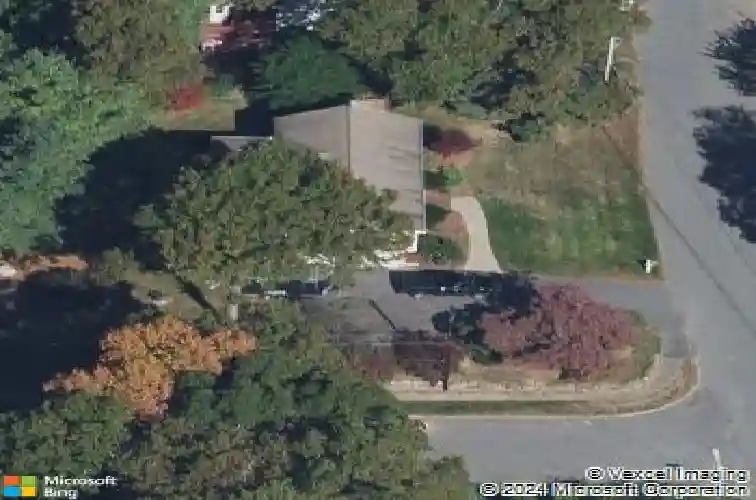
22 Sunset Dr, Medway, MA 02053
Member Features
Find Real Estate Bargain!
Full foreclosure details
Home value, equity and ownership info
Find homes priced below market
Get full access with a FREE Account
Already a member?
For Sale
Off Market
Home type
Price / sqft
Year built
Home Details
A beautiful updated home located within a desirable established neighborhood. Close to /easy access to the town center for dining, shopping & the McGovern Elementary school. Offering a spacious large family room, a tranquil vaulted sunroom & an extra-large entertainment room. Renovated kitchen, vaulted ceiling sunroom, dining room, living room, walk-out brick patio w/ deck above. Separate entrance to 4th BR/office from the patio, great for a home office. New Roof July 25 w/ a 5-year transferable workmanship warranty & 45 year prorated shingle warranty Vinyl siding 2015 Vinyl & wood insulated windows 2 masonry fireplaces Granite counters, Thomasville cherry kitchen cabinets w/ stainless appliances. 4 BRs & 3 full updated bathrooms Master & hall bathrooms have radiant heated floors Attached large 2 car garage White oak hardwood, tile & laminate floors. Yard irrigation system Easy access 495 & commuter rail Franklin/Norfolk Shed on site
Interior Details
1456
4
3
Has Heating:
Yes
Heating Type:
Hot Water
Has Cooling:
No
Cooling Type:
N/A
Has Fuel:
Yes
Fuel Type:
Oil
Has Basement:
No
Basement Type:
Partial
Has Flooring:
No
Flooring Type:
N/A
Has Fireplace:
Yes
Fireplace Type:
N/A
Property Details
11326
No
No
Type:
Garage, Basement
Location:
N/A
Status:
N/A
Number of Spaces:
2
N/A
N/A
N/A
N/A
N/A
N/A
N/A
Construction Details
Raised Ranch
Aluminum/vinyl
N/A
Gable
Asphalt
Tax History
Year
Amount
Land
Improvement
Percent Change
Assessment
2020
$6,640
$177,500
$201,900
--%
$379,400
2019
$6,316
$177,500
$194,700
--%
$372,200
2018
$6,368
$169,400
$191,200
--%
$360,600
2017
$6,322
$163,400
$189,400
--%
$352,800
2016
$6,166
$157,300
$183,200
--%
$340,500
2014
$5,643
$145,200
$154,300
--%
$299,500
2013
$5,559
$145,200
$154,300
--%
$299,500

Average Home Price in 02053
Nearby Properties
Zip Code
Price
Bed
Bath
Sqft
Lot
Sold Date
$809,000
$809,000
4 Beds
3 Baths
1,456 Sqft
11,326 Lot (sqft)
Sold 10/13/2026
$602,265
$602,265
3 Beds
2 Baths
1,531 Sqft
21,780 Lot (sqft)
Sold 10/13/2026
$731,946
$731,946
4 Beds
1.5 Baths
1,570 Sqft
14,153 Lot (sqft)
Sold 10/13/2026
$--
5 Beds
2 Baths
1,542 Sqft
23,958 Lot (sqft)
Sold 10/18/2026