Member Features
Find Real Estate Bargain!
Full foreclosure details
Home value, equity and ownership info
Find homes priced below market
Get full access with a FREE Account
Already a member?
$660,000
Listing Price$1,065,000Est. Opening Bid3beds
2.5baths
2,190sqft
7,500sqft lot
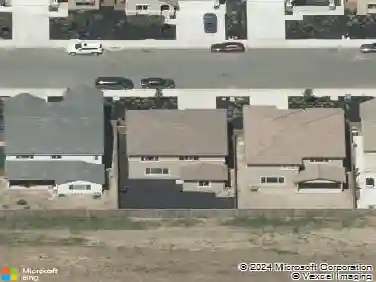
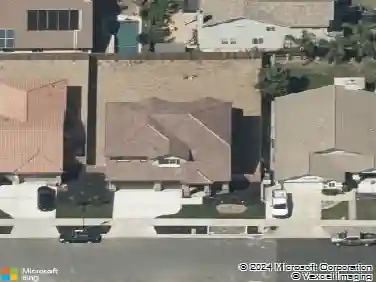
39 Stony Hill Ct, Oakley, CA 94561
Member Features
Find Real Estate Bargain!
Full foreclosure details
Home value, equity and ownership info
Find homes priced below market
Get full access with a FREE Account
Already a member?
Pre-Foreclosure
For Sale
Off Market
Home type
Price / sqft
Year built
Home Details
Welcome Home to 39 Stony Hill Ct.! Nestled in the heart of Oakley on a quiet cul-de-sac with no rear neighbors, this 2,190-square-foot home offers comfort, space, and privacy. Featuring 3 bedrooms and 2.5 bathrooms, the thoughtfully designed floor plan provides generous living spaces ideal for everyday living and entertaining. Soaring ceilings and an abundance of natural light create a bright and welcoming atmosphere from the moment you step inside. The well-appointed kitchen features granite countertops and stainless-steel appliances, offering both functionality and style. Adding to the homes appeal are Tesla Powerwalls, providing emergency backup power while storing excess solar energy to help reduce household electricity costs. With its spacious interior, desirable location, and energy-efficient features, 39 Stony Hill Ct. is a wonderful place to call home.
Interior Details
2190
3
2.5
Has Heating:
Yes
Heating Type:
Forced Air With Air Conditioning
Has Cooling:
Yes
Cooling Type:
Central
Has Fuel:
Yes
Fuel Type:
Gas
Has Basement:
No
Basement Type:
N/A
Has Flooring:
No
Flooring Type:
N/A
Has Fireplace:
Yes
Fireplace Type:
N/A
Property Details
7500
Yes
Yes
Type:
Garage, Attached
Location:
N/A
Status:
N/A
Number of Spaces:
2
N/A
N/A
N/A
N/A
N/A
N/A
N/A
Construction Details
Traditional/old
Stucco
N/A
N/A
Tile
Tax History
Year
Amount
Land
Improvement
Percent Change
Assessment
2020
$6,672
$189,425
$319,953
--%
$509,378
2019
$6,457
$185,711
$313,680
--%
$499,391
2018
$6,283
$182,070
$307,530
--%
$489,600
2017
$3,614
$59,011
$191,489
--%
$250,500
2016
$3,432
$57,854
$187,735
--%
$245,589
2014
$3,409
$55,869
$181,294
--%
$237,163
2013
$3,401
$55,617
$180,475
--%
$236,092
2012
$2,966
$54,527
$176,937
--%
$231,464

Average Home Price in 94561
Nearby Properties
Zip Code
Price
Bed
Bath
Sqft
Lot
Sold Date
$616,848
$616,848
4 Beds
2.5 Baths
1,933 Sqft
8,753 Lot (sqft)
Sold 07/01/2026
$644,654
$644,654
6 Beds
6 Baths
2,035 Sqft
6,000 Lot (sqft)
Sold 06/24/2026
$581,250
$581,250
4 Beds
2.5 Baths
1,933 Sqft
6,000 Lot (sqft)
Sold 06/04/2026
$684,982
$684,982
4 Beds
3 Baths
2,018 Sqft
6,500 Lot (sqft)
Sold 10/27/2026
$660,000
$660,000
3 Beds
2.5 Baths
2,190 Sqft
7,500 Lot (sqft)
Sold 10/26/2026
$647,517
$647,517
3 Beds
2.5 Baths
2,190 Sqft
6,000 Lot (sqft)
Sold 10/13/2026
$650,000
$650,000
3 Beds
3 Baths
2,190 Sqft
6,460 Lot (sqft)
Sold 10/27/2026
$618,788
$618,788
4 Beds
2.5 Baths
1,933 Sqft
7,930 Lot (sqft)
Sold 10/26/2026
$635,221
$635,221
3 Beds
2.5 Baths
2,190 Sqft
7,350 Lot (sqft)
Sold 10/26/2026