Member Features
Find Real Estate Bargain!
Full foreclosure details
Home value, equity and ownership info
Find homes priced below market
Get full access with a FREE Account
Already a member?
$258,376
Listing Price3beds
1.5baths
1,352sqft
11,600sqft lot
9931 Shore Dr, Machesney Park, IL 61115
Member Features
Find Real Estate Bargain!
Full foreclosure details
Home value, equity and ownership info
Find homes priced below market
Get full access with a FREE Account
Already a member?
For Sale
Off Market
Home type
Price / sqft
Year built
Home Details
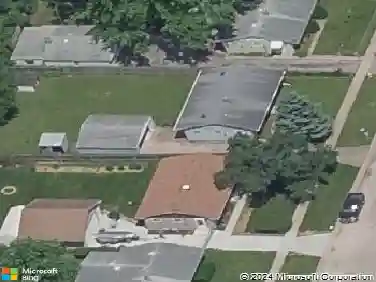
This meticulously cared-for 3 bedroom, 1.5 bath home offers a long list of high-value updates inside and out. Enjoy peace of mind with new windows (2018), a new furnace and water softener (approx. 2018), and a full basement already studded out and ready to finish. The exterior has been transformed with new siding, roof, and gutters (2021), a new driveway with added parking (2022), and continued professional lawn care. The backyard is a true oasis featuring two gazebos, a hot tub with a dedicated cement pad, and a 12x16 shed with lofts plus electric service. Additional upgrades include: New central air (2020) April Aire system (2020) New garage door & springs (2022) Larger upgraded hot tub gazebo (2023) Garage-to-hot-tub access door (2024) HQ video garage door opener (2025) With countless improvements already completed, this home is truly move-in ready and offers exceptional value for its next owner! Per FEMA maps, property is NOT located in a designated flood zone.
Interior Details
1352
3
1.5
Has Heating:
Yes
Heating Type:
Gas
Has Cooling:
No
Cooling Type:
N/A
Has Fuel:
Yes
Fuel Type:
Gas
Has Basement:
No
Basement Type:
Basement (unspecified)
Has Flooring:
No
Flooring Type:
N/A
Has Fireplace:
Yes
Fireplace Type:
N/A
Property Details
11600
No
No
Type:
N/A
Location:
N/A
Status:
N/A
Number of Spaces:
N/A
N/A
N/A
N/A
N/A
N/A
N/A
N/A
Construction Details
Old
Aluminum/vinyl
N/A
N/A
Asphalt
Tax History
Year
Amount
Land
Improvement
Percent Change
Assessment
2019
$2,998
$6,623
$29,756
--%
$36,379
2018
$3,197
$6,406
$28,780
--%
$35,186
2017
$3,135
$6,230
$27,991
--%
$34,221
2016
$3,082
$6,106
$27,434
--%
$33,540
2015
$3,053
$5,999
$26,954
--%
$32,953
2013
$3,004
$6,253
$28,095
--%
$34,348
2012
$2,970
$6,632
$29,796
--%
$36,428
2011
$2,896
$6,908
$31,038
--%
$37,946

Average Home Price in 61115
Nearby Properties
Zip Code
Price
Bed
Bath
Sqft
Lot
Sold Date
$214,115
3 Beds
1 Baths
1,281 Sqft
11,250 Lot (sqft)
Sold 09/29/2026
$170,083
3 Beds
1.5 Baths
1,164 Sqft
9,193 Lot (sqft)
Sold 10/26/2026
$258,376
3 Beds
1.5 Baths
1,352 Sqft
11,600 Lot (sqft)
Sold 10/27/2026
$159,900
3 Beds
2 Baths
1,426 Sqft
13,883 Lot (sqft)
Sold 10/26/2026
$240,000
3 Beds
2 Baths
1,360 Sqft
16,697 Lot (sqft)
Sold 10/13/2026
$285,229
3 Beds
1.5 Baths
1,396 Sqft
12,575 Lot (sqft)
Sold 10/27/2026
$240,000
4 Beds
1.5 Baths
1,352 Sqft
9,472 Lot (sqft)
Sold 10/13/2026
$225,785
3 Beds
2 Baths
1,328 Sqft
7,590 Lot (sqft)
Sold 10/27/2026