
Member Features
Find Real Estate Bargain!
Full foreclosure details
Home value, equity and ownership info
Find homes priced below market
Get full access with a FREE Account
Already a member?
$2,000,000
Listing Price4beds
1.5baths
1,248sqft
85,302sqft lot
375 Sandwich Rd, East Falmouth, MA 02536
Member Features
Find Real Estate Bargain!
Full foreclosure details
Home value, equity and ownership info
Find homes priced below market
Get full access with a FREE Account
Already a member?
For Sale
Off Market
Home type
Price / sqft
Year built
Home Details
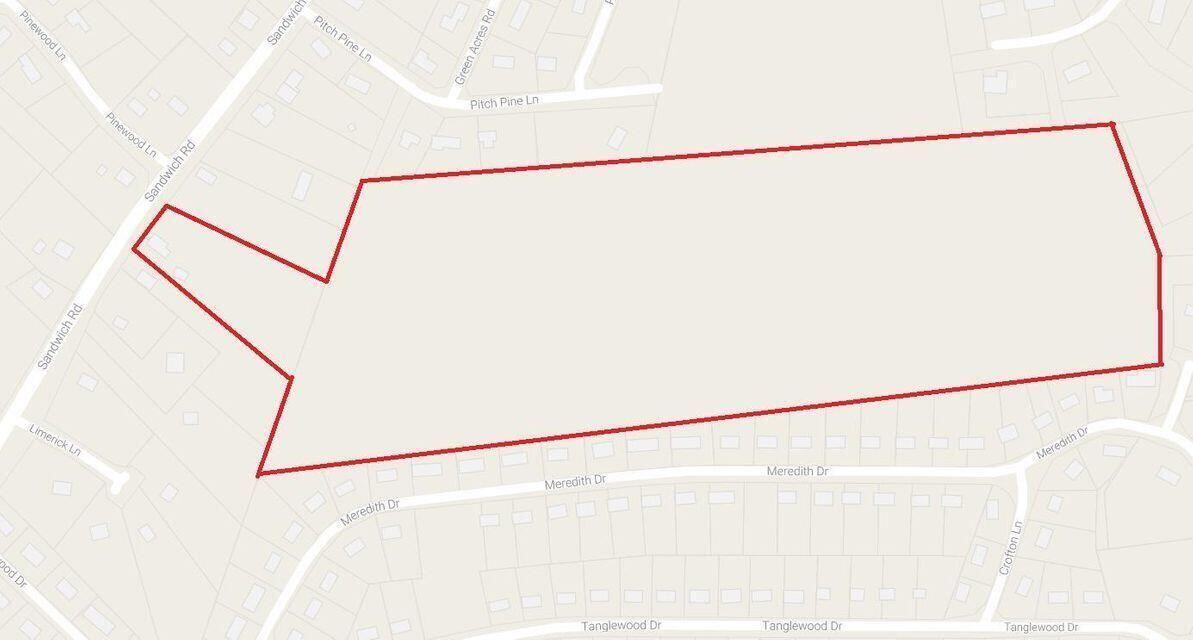
Rare opportunity to purchase 28+ acres! This listing includes 2 parcels: 375 Sandwich Road Assessors Map 27 06 011 000 and 0 Sandwich Road Assessors Map 27 06 031 000. Residence at 375 Sandwich Road would most likely be removed for development. The preliminary plan is certified by a registered surveyor at a total of 28.8 acres.
Interior Details
1248
4
1.5
Has Heating:
Yes
Heating Type:
Hot Water
Has Cooling:
No
Cooling Type:
N/A
Has Fuel:
Yes
Fuel Type:
Oil
Has Basement:
No
Basement Type:
Unfinished
Has Flooring:
No
Flooring Type:
N/A
Has Fireplace:
Yes
Fireplace Type:
N/A
Property Details
85302
No
No
Type:
Garage, Detached
Location:
N/A
Status:
N/A
Number of Spaces:
0
N/A
N/A
N/A
N/A
N/A
N/A
N/A
Construction Details
Bungalow
Wood Siding
N/A
Gable
Asphalt
Tax History
Year
Amount
Land
Improvement
Percent Change
Assessment
2020
$2,123
$130,300
$116,900
--%
$247,200
2019
$2,116
$130,300
$116,900
--%
$247,200
2018
$2,069
$130,300
$110,300
--%
$240,600
2017
$2,050
$130,300
$110,000
--%
$240,300
2016
$2,011
$130,300
$110,000
--%
$240,300
2014
$2,015
$137,100
$110,100
--%
$247,200
2013
$2,029
$137,100
$115,300
--%
$252,400

Average Home Price in 02536
Nearby Properties
Zip Code
Price
Bed
Bath
Sqft
Lot
Sold Date
$413,427
2 Beds
1 Baths
1,344 Sqft
25,216 Lot (sqft)
Sold 05/20/2026
$535,000
3 Beds
2 Baths
1,082 Sqft
23,300 Lot (sqft)
Sold 10/27/2026
$680,493
3 Beds
1 Baths
1,150 Sqft
10,610 Lot (sqft)
Sold 10/26/2026
$605,620
3 Beds
2 Baths
1,417 Sqft
14,000 Lot (sqft)
Sold 10/26/2026
$2,000,000
$2,000,000
4 Beds
1.5 Baths
1,248 Sqft
85,302 Lot (sqft)
Sold 10/26/2026
$670,000
4 Beds
1 Baths
1,346 Sqft
16,700 Lot (sqft)
Sold 10/26/2026
$495,058
3 Beds
1.5 Baths
1,232 Sqft
14,400 Lot (sqft)
Sold 10/27/2026
$459,043
4 Beds
1.5 Baths
1,152 Sqft
15,314 Lot (sqft)
Sold 10/27/2026