Member Features
Find Real Estate Bargain!
Full foreclosure details
Home value, equity and ownership info
Find homes priced below market
Get full access with a FREE Account
Already a member?
$459,013
Sold Price3beds
2baths
2,084sqft
10,629sqft lot
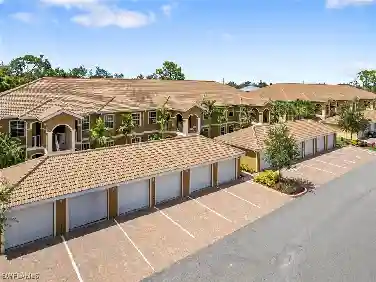
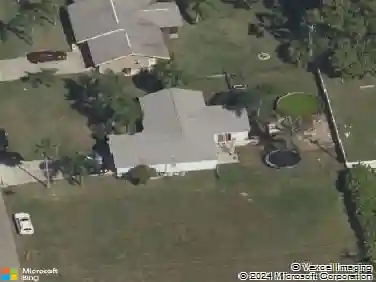
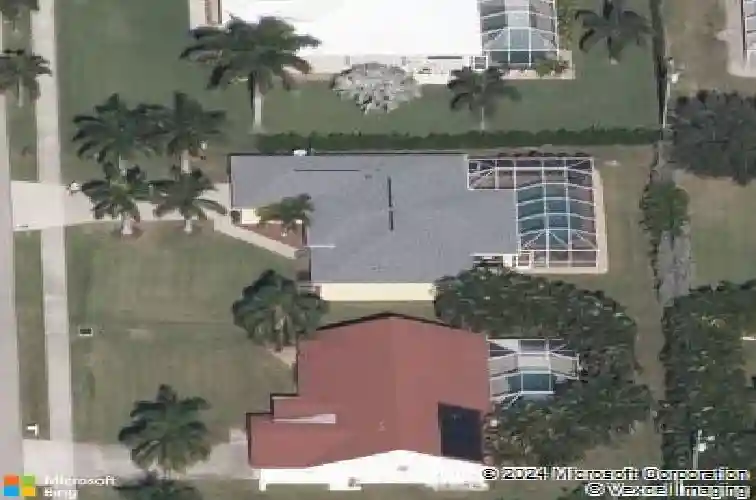
5239 Sands Blvd, Cape Coral, FL 33914
Member Features
Find Real Estate Bargain!
Full foreclosure details
Home value, equity and ownership info
Find homes priced below market
Get full access with a FREE Account
Already a member?
Recently Sold
Off Market
Home type
Price / sqft
Year built
Home Details
Interior Details
2084
3
2
Has Heating:
Yes
Heating Type:
Forced Air With Air Conditioning
Has Cooling:
Yes
Cooling Type:
Central
Has Fuel:
Yes
Fuel Type:
Electric
Has Basement:
No
Basement Type:
N/A
Has Flooring:
No
Flooring Type:
Carpet
Has Fireplace:
Yes
Fireplace Type:
N/A
Property Details
10629
No
No
Type:
Garage, Attached
Location:
N/A
Status:
N/A
Number of Spaces:
2
No
No
No
No
No
No
No
Construction Details
Ranch
Concrete Block/stucco
N/A
Cathedral/clerestory
Asphalt
Tax History
Year
Amount
Land
Improvement
Percent Change
Assessment
2020
$4,690
$55,000
$151,714
--%
$206,714
2019
$4,838
$55,000
$153,323
--%
$208,323
2018
$4,702
$51,000
$144,411
--%
$195,411
2017
$4,846
$45,000
$153,639
--%
$198,639
2016
$4,704
$45,000
$143,862
--%
$188,862
2014
$3,443
$0
$0
--%
$121,001
2013
$3,142
$0
$0
--%
$114,007
2012
$2,887
$0
$0
--%
$102,893

Average Home Price in 33914
Nearby Properties
Zip Code
Price
Bed
Bath
Sqft
Lot
Sold Date
$803,427
$803,427
3 Beds
2 Baths
1,939 Sqft
10,019 Lot (sqft)
Sold 10/01/2026
$--
3 Beds
2 Baths
2,235 Sqft
10,019 Lot (sqft)
Sold 09/30/2026
$492,768
$492,768
3 Beds
2 Baths
1,986 Sqft
10,019 Lot (sqft)
Sold 09/30/2026
$459,013
$459,013
3 Beds
2 Baths
2,084 Sqft
10,629 Lot (sqft)
Sold 09/23/2026
$472,522
$472,522
3 Beds
2 Baths
2,183 Sqft
12,763 Lot (sqft)
Sold 08/27/2026
$867,564
$867,564
3 Beds
2.5 Baths
2,220 Sqft
10,019 Lot (sqft)
Sold 06/30/2026
$849,900
$849,900
4 Beds
3 Baths
2,148 Sqft
10,019 Lot (sqft)
Sold 11/15/2025
$665,535
$665,535
3 Beds
2 Baths
2,209 Sqft
10,019 Lot (sqft)
Sold 10/27/2026
$699,000
$699,000
4 Beds
3 Baths
2,337 Sqft
10,019 Lot (sqft)
Sold 10/26/2026