Member Features
Find Real Estate Bargain!
Full foreclosure details
Home value, equity and ownership info
Find homes priced below market
Get full access with a FREE Account
Already a member?
$2,038,811
Sold Price4beds
3baths
3,447sqft
7,410sqft lot
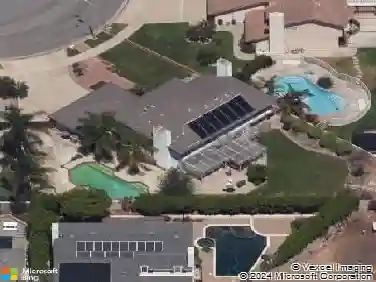
2712 N Roxbury St, Orange, CA 92867
Member Features
Find Real Estate Bargain!
Full foreclosure details
Home value, equity and ownership info
Find homes priced below market
Get full access with a FREE Account
Already a member?
Recently Sold
Off Market
Home type
Price / sqft
Year built
Home Details
Interior Details
3447
4
3
Has Heating:
No
Heating Type:
N/A
Has Cooling:
No
Cooling Type:
N/A
Has Fuel:
No
Fuel Type:
N/A
Has Basement:
No
Basement Type:
N/A
Has Flooring:
No
Flooring Type:
N/A
Has Fireplace:
Yes
Fireplace Type:
N/A
Property Details
7410
No
No
Type:
N/A
Location:
N/A
Status:
N/A
Number of Spaces:
N/A
N/A
N/A
N/A
N/A
N/A
N/A
N/A
Construction Details
N/A
N/A
N/A
N/A
N/A
Tax History
Year
Amount
Land
Improvement
Percent Change
Assessment
2020
$6,563
$175,193
$416,933
--%
$592,126
2019
$6,480
$171,758
$408,758
--%
$580,516
2018
$6,382
$168,390
$400,744
--%
$569,134
2017
$6,117
$165,088
$392,887
--%
$557,975
2016
$5,999
$161,851
$385,184
--%
$547,035
2014
$5,713
$156,297
$371,968
--%
$528,265
2013
$5,704
$155,591
$370,287
--%
$525,878
2012
$5,443
$152,540
$363,027
--%
$515,567

Average Home Price in 92867
Nearby Properties
Zip Code
Price
Bed
Bath
Sqft
Lot
Sold Date
$1,976,871
$1,976,871
4 Beds
3 Baths
3,447 Sqft
7,936 Lot (sqft)
Sold 10/03/2026
$1,616,380
$1,616,380
4 Beds
3 Baths
3,303 Sqft
7,700 Lot (sqft)
Sold 09/05/2026
$1,764,419
$1,764,419
4 Beds
3 Baths
3,441 Sqft
20,700 Lot (sqft)
Sold 09/01/2026
$2,008,724
$2,008,724
4 Beds
3 Baths
3,489 Sqft
13,392 Lot (sqft)
Sold 08/25/2026
$2,038,811
$2,038,811
4 Beds
3 Baths
3,447 Sqft
7,410 Lot (sqft)
Sold 07/28/2026
$1,569,041
$1,569,041
4 Beds
2.5 Baths
2,954 Sqft
13,300 Lot (sqft)
Sold 06/30/2026
$1,499,574
$1,499,574
4 Beds
2.5 Baths
2,954 Sqft
8,260 Lot (sqft)
Sold 10/26/2026
$1,581,227
$1,581,227
4 Beds
3.5 Baths
3,066 Sqft
8,400 Lot (sqft)
Sold 10/27/2026
$2,303,860
$2,303,860
4 Beds
3 Baths
3,489 Sqft
10,725 Lot (sqft)
Sold 10/27/2026
Calculators
Mortgage
Mortgage Calculator
Details for 2712 N ROXBURY ST
Property Debt
Foreclosure Contact Details
Similar Homes Nearby


Guides for Roxbury St

Santa Ana’s real estate market shows substantial growth, with home values reaching $970K in June 2024, up from $799.5K in July 2023. Neighboring cities also display varied market trends. The data indicates a promising market for potential buyers and investors.