Member Features
Find Real Estate Bargain!
Full foreclosure details
Home value, equity and ownership info
Find homes priced below market
Get full access with a FREE Account
Already a member?
$230,000
Listing Price3beds
2baths
1,283sqft
20,199sqft lot
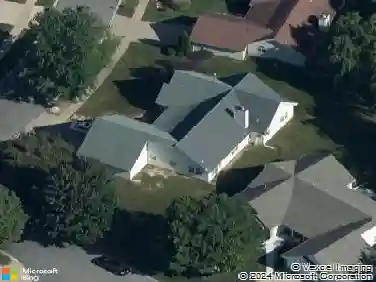
42 Rolling Hills Dr, Black Jack, MO 63033
Member Features
Find Real Estate Bargain!
Full foreclosure details
Home value, equity and ownership info
Find homes priced below market
Get full access with a FREE Account
Already a member?
For Sale
Off Market
Home type
Price / sqft
Year built
Home Details
Privacy & tranquility in Black Jack. On a secluded street in a single entry neighborhood, this delightful 3 bd, 2 bth home with new gutters, offers a level lot set on a near half acre lot backing to trees. Upon entry you'll notice the updated lighting & refinished hardwood floors w/ a warm, wood-burning fireplace & large windows. Flowing seamlessly from the living room is the kitchen, equipped w/ ample cabinetry & double oven. Off the kitchen, the sitting room features a sliding door that opens onto a newer deck, perfect for enjoying your morning coffee or hosting summer bbq. You will also find one a full bath & comfortable bedrooms with new doors. The lower level bath adds convenience, making it easy to entertain guests. The level yard is a true gem, offering plenty of room for gardening and outdoor activities. Close to major roads yet off the beaten path, whether youre a first-time buyer, looking to downsize, or seeking a rental investment, this charming residence is a must-see!
Interior Details
1283
3
2
Has Heating:
Yes
Heating Type:
Yes
Has Cooling:
Yes
Cooling Type:
Central
Has Fuel:
Yes
Fuel Type:
Electric
Has Basement:
No
Basement Type:
Full
Has Flooring:
No
Flooring Type:
N/A
Has Fireplace:
Yes
Fireplace Type:
N/A
Property Details
20199
Yes
Yes
Type:
Garage, Attached
Location:
N/A
Status:
N/A
Number of Spaces:
1
N/A
N/A
N/A
N/A
N/A
N/A
N/A
Construction Details
Ranch
Aluminum/vinyl
N/A
N/A
N/A
Tax History
Year
Amount
Land
Improvement
Percent Change
Assessment
2020
$1,958
$5,420
$12,880
--%
$18,300
2019
$1,932
$5,420
$12,880
--%
$18,300
2018
$2,065
$2,390
$15,680
--%
$18,070
2017
$2,063
$2,390
$15,680
--%
$18,070
2016
$1,670
$2,770
$11,590
--%
$14,360
2013
$1,927
$3,520
$14,100
--%
$17,620
2013
$1,927
$3,520
$14,100
--%
$17,620
2012
$1,682
$3,170
$13,150
--%
$16,320

Average Home Price in 63033
Nearby Properties
Zip Code
Price
Bed
Bath
Sqft
Lot
Sold Date
$166,069
3 Beds
1 Baths
1,167 Sqft
8,499 Lot (sqft)
Sold 10/24/2026
$159,000
3 Beds
1 Baths
1,092 Sqft
7,802 Lot (sqft)
Sold 10/26/2026
$249,900
$249,900
3 Beds
2 Baths
1,318 Sqft
7,802 Lot (sqft)
Sold 10/27/2026
$219,900
$219,900
3 Beds
2 Baths
1,320 Sqft
20,303 Lot (sqft)
Sold 10/27/2026
$152,322
$152,322
3 Beds
1 Baths
1,292 Sqft
9,396 Lot (sqft)
Sold 10/26/2026
$230,000
3 Beds
2 Baths
1,283 Sqft
20,199 Lot (sqft)
Sold 11/02/2026
$249,379
$249,379
3 Beds
2 Baths
1,342 Sqft
8,159 Lot (sqft)
Sold 10/13/2026
$190,856
2 Beds
2 Baths
1,398 Sqft
20,125 Lot (sqft)
Sold 10/26/2026
$278,386
3 Beds
2 Baths
1,318 Sqft
7,789 Lot (sqft)
Sold 10/13/2026