Member Features
Find Real Estate Bargain!
Full foreclosure details
Home value, equity and ownership info
Find homes priced below market
Get full access with a FREE Account
Already a member?
$420,400
Sold Price3beds
2baths
1,288sqft
6,970sqft lot
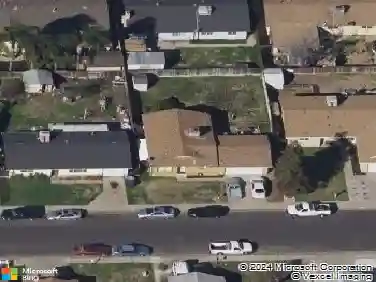
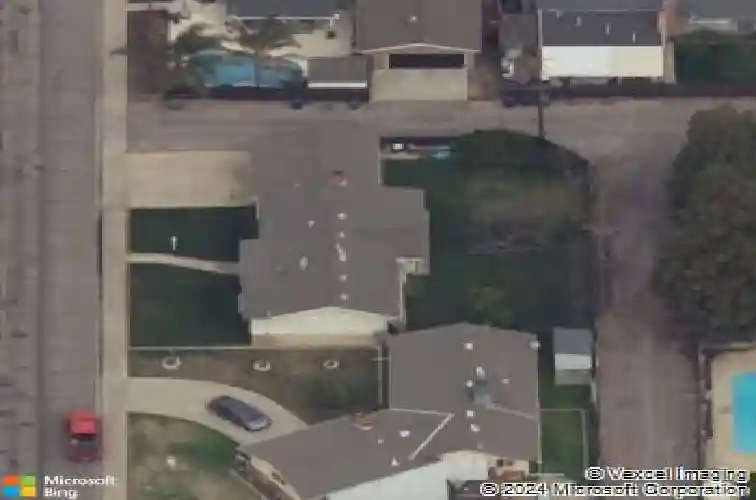
760 N Quincy Rd, Turlock, CA 95380
Member Features
Find Real Estate Bargain!
Full foreclosure details
Home value, equity and ownership info
Find homes priced below market
Get full access with a FREE Account
Already a member?
Recently Sold
Off Market
Home type
Price / sqft
Year built
Home Details
Interior Details
1288
3
2
Has Heating:
Yes
Heating Type:
Central
Has Cooling:
Yes
Cooling Type:
Central
Has Fuel:
No
Fuel Type:
N/A
Has Basement:
No
Basement Type:
N/A
Has Flooring:
No
Flooring Type:
N/A
Has Fireplace:
Yes
Fireplace Type:
N/A
Property Details
6970
No
No
Type:
N/A
Location:
N/A
Status:
N/A
Number of Spaces:
N/A
N/A
N/A
N/A
N/A
N/A
N/A
N/A
Construction Details
N/A
N/A
N/A
N/A
N/A
Tax History
Year
Amount
Land
Improvement
Percent Change
Assessment
2020
$1,520
$57,421
$79,243
--%
$136,664
2019
$1,495
$56,296
$77,690
--%
$133,986
2018
$1,494
$55,193
$76,167
--%
$131,360
2017
$1,459
$54,111
$74,674
--%
$128,785
2016
$1,362
$53,050
$73,210
--%
$126,260
2014
$1,337
$51,000
$70,380
--%
$121,380
2013
$1,345
$51,000
$70,380
--%
$121,380
2012
$548
$50,000
$69,000
--%
$119,000

Average Home Price in 95380
Nearby Properties
Zip Code
Price
Bed
Bath
Sqft
Lot
Sold Date
$410,418
$410,418
3 Beds
2 Baths
1,167 Sqft
5,663 Lot (sqft)
Sold 10/01/2026
$395,108
$395,108
3 Beds
2 Baths
1,104 Sqft
6,739 Lot (sqft)
Sold 09/25/2026
$589,532
$589,532
3 Beds
2 Baths
1,388 Sqft
8,271 Lot (sqft)
Sold 08/14/2026
$358,700
$358,700
2 Beds
1 Baths
1,098 Sqft
7,841 Lot (sqft)
Sold 08/14/2026
$448,483
$448,483
3 Beds
1 Baths
1,200 Sqft
6,534 Lot (sqft)
Sold 08/05/2026
$512,942
$512,942
4 Beds
2 Baths
1,416 Sqft
4,356 Lot (sqft)
Sold 07/07/2026
$393,007
$393,007
3 Beds
2 Baths
1,156 Sqft
5,663 Lot (sqft)
Sold 07/01/2026
$397,615
$397,615
3 Beds
1 Baths
1,264 Sqft
7,405 Lot (sqft)
Sold 07/01/2026
$420,400
$420,400
3 Beds
2 Baths
1,288 Sqft
6,970 Lot (sqft)
Sold 06/25/2026