Member Features
Find Real Estate Bargain!
Full foreclosure details
Home value, equity and ownership info
Find homes priced below market
Get full access with a FREE Account
Already a member?
$619,900
Listing Price5beds
4baths
2,382sqft
29,901sqft lot
10105 Quince Apple Ct, Upper Marlboro, MD 20772
Member Features
Find Real Estate Bargain!
Full foreclosure details
Home value, equity and ownership info
Find homes priced below market
Get full access with a FREE Account
Already a member?
For Sale
Off Market
Home type
Price / sqft
Year built
Home Details
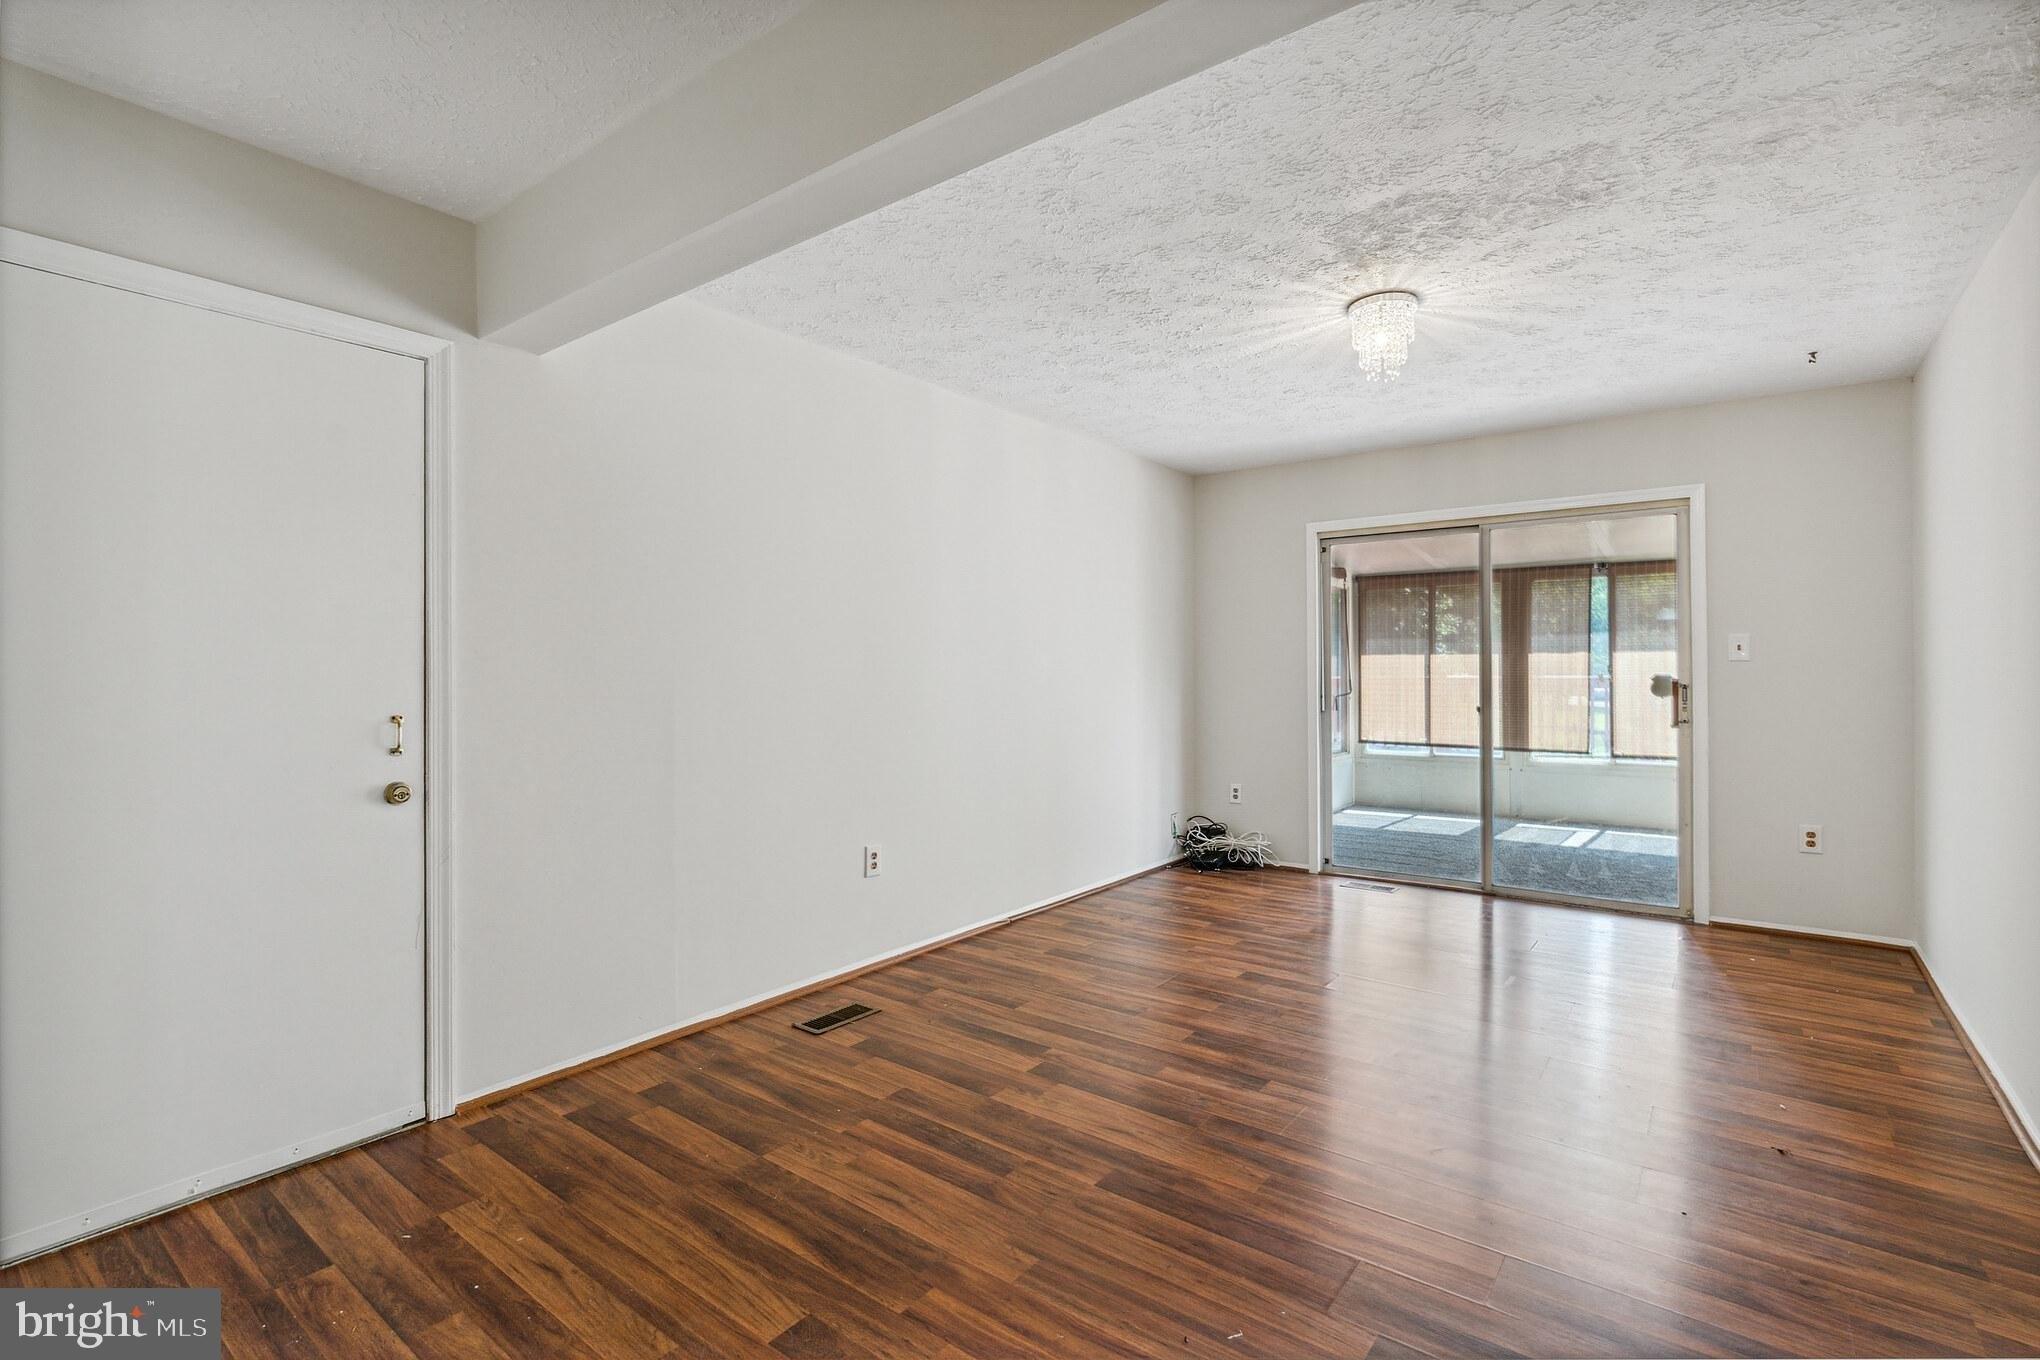
Finally a House Worth Coming Home To ! Welcome to your dream home in Upper Marlboro! This stunning property boasts a spacious living and dining room flooded with natural light, perfect for entertaining guests or enjoying a quiet evening at home. The large kitchen opens to a charming breakfast nook, ideal for sipping your morning coffee while taking in the serene backyard views. Cozy up by the fireplace in the family room, or retreat to the luxurious primary bedroom with a sitting room for ultimate relaxation. The finished recreation room is perfect for movie nights or hosting game day gatherings, with easy access to the meticulously manicured backyard featuring a basketball court for endless outdoor fun. Situated on just over half an acre, this home offers the perfect blend of indoor and outdoor living spaces. Don't miss your chance to own this one-of-a-kind property in a desirable location. Welcome home!nnOpen House this Sun between 1p-3pm
Interior Details
2382
5
4
Has Heating:
Yes
Heating Type:
Yes
Has Cooling:
Yes
Cooling Type:
Central
Has Fuel:
No
Fuel Type:
N/A
Has Basement:
No
Basement Type:
Finished
Has Flooring:
No
Flooring Type:
N/A
Has Fireplace:
Yes
Fireplace Type:
N/A
Property Details
29901
No
Yes
Type:
Garage, Attached
Location:
N/A
Status:
N/A
Number of Spaces:
2
N/A
N/A
N/A
N/A
N/A
N/A
N/A
Construction Details
Conventional
N/A
N/A
N/A
Composition Shingle
Tax History
Year
Amount
Land
Improvement
Percent Change
Assessment
2021
$5,109
$0
$0
--%
$324,100
2020
$5,017
$102,500
$215,300
--%
$317,800
2019
$4,867
$0
$0
--%
$305,267
2018
$4,747
$0
$0
--%
$292,733
2017
$4,545
$102,500
$177,700
--%
$280,200
2015
$4,360
$0
$0
--%
$276,933
2014
$4,337
$102,500
$172,800
--%
$275,300
2012
$4,569
$0
$0
--%
$275,300

Average Home Price in 20772
Nearby Properties
Zip Code
Price
Bed
Bath
Sqft
Lot
Sold Date
$584,536
-- Beds
2.5 Baths
2,646 Sqft
28,612 Lot (sqft)
Sold 05/25/2026
$368,000
3 Beds
2 Baths
2,138 Sqft
10,479 Lot (sqft)
Sold 10/26/2026
$433,532
4 Beds
3 Baths
2,237 Sqft
11,727 Lot (sqft)
Sold 10/27/2026
$631,689
-- Beds
3.5 Baths
2,560 Sqft
21,083 Lot (sqft)
Sold 10/26/2026
$589,333
4 Beds
2.5 Baths
2,352 Sqft
34,727 Lot (sqft)
Sold 10/26/2026
$598,396
-- Beds
2.5 Baths
2,626 Sqft
14,539 Lot (sqft)
Sold 10/27/2026
$619,900
5 Beds
4 Baths
2,382 Sqft
29,901 Lot (sqft)
Sold 10/13/2026
$714,366
-- Beds
2.5 Baths
2,641 Sqft
205,603 Lot (sqft)
Sold 10/27/2026