Member Features
Find Real Estate Bargain!
Full foreclosure details
Home value, equity and ownership info
Find homes priced below market
Get full access with a FREE Account
Already a member?
$799,000
Listing Price2beds
2baths
1,497sqft
41,817sqft lot
320 E Queen Way, Sparks, NV 89431
Member Features
Find Real Estate Bargain!
Full foreclosure details
Home value, equity and ownership info
Find homes priced below market
Get full access with a FREE Account
Already a member?
For Sale
Off Market
Home type
Price / sqft
Year built
Home Details
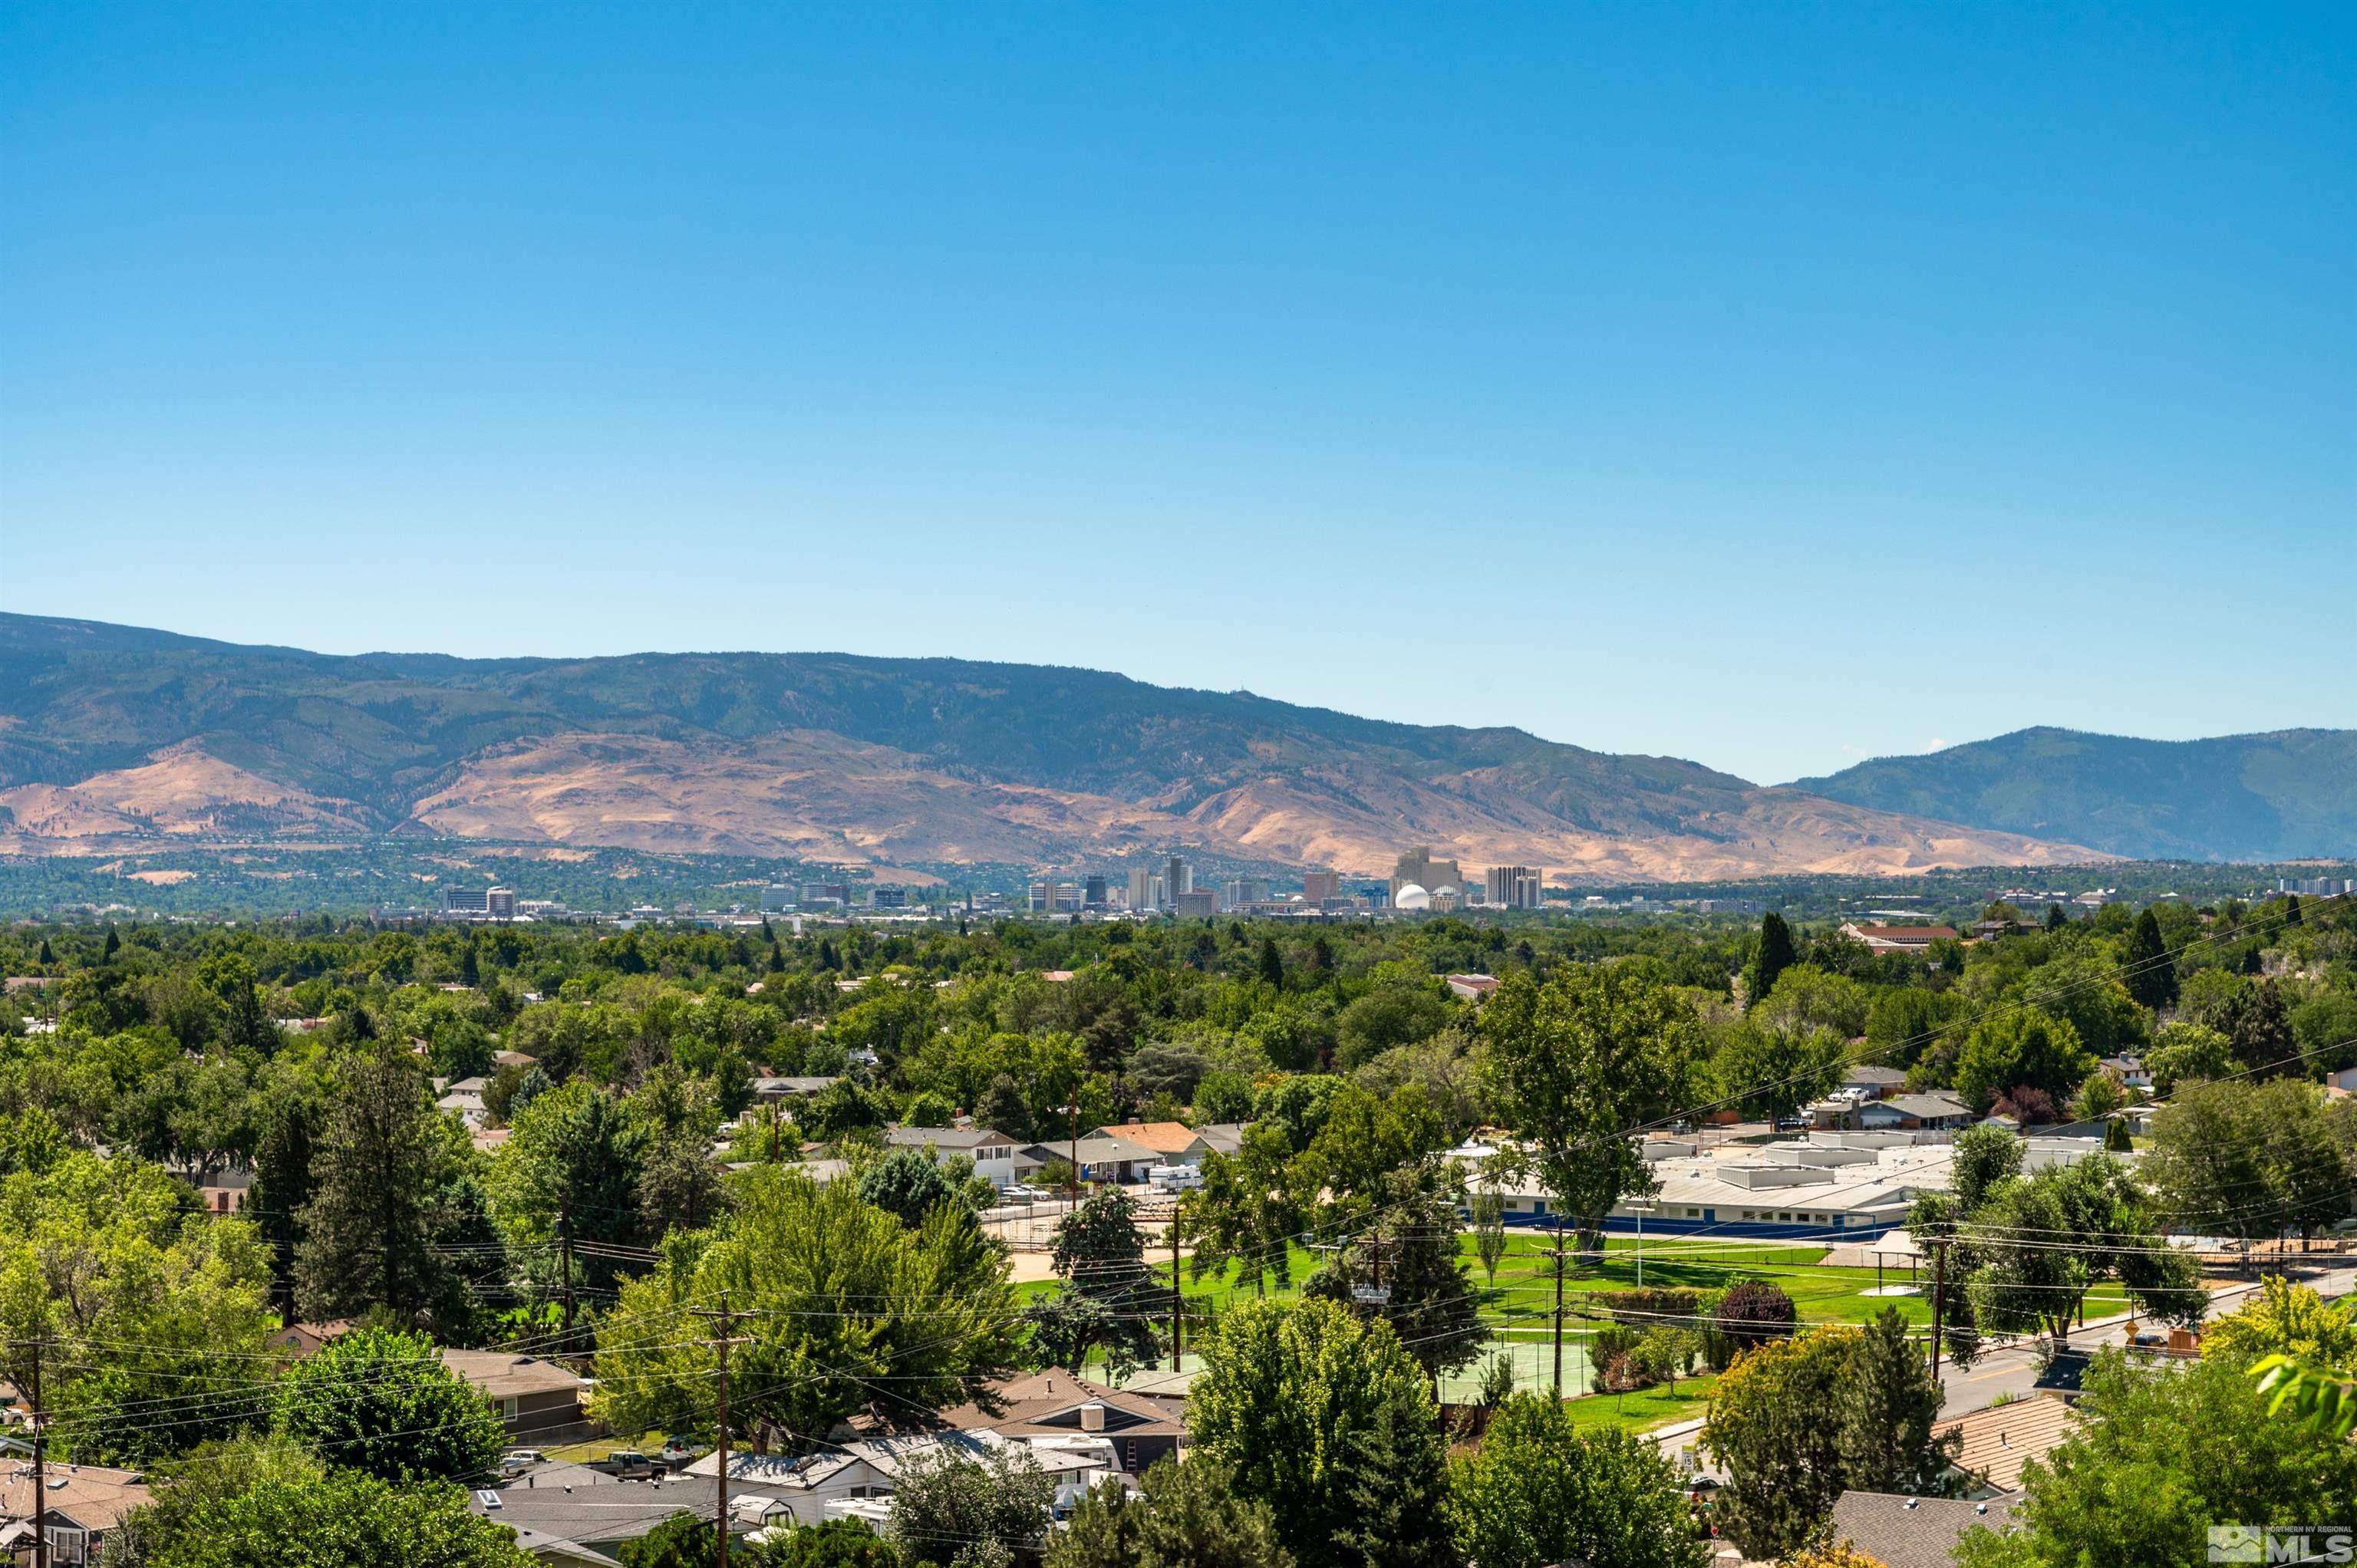
Nestled on nearly 1 acre in Sparks, this property boasts breathtaking city, valley, and mountain views that can be enjoyed from multiple vantage points throughout the home. The living room, kitchen, dining room, and large deck are all designed to capture these stunning vistas. The main bedroom is conveniently located on the main level, while the lower level features a spacious finished basement with an additional bedroom and bathroom, offering privacy and versatility. Outdoor living is a dream here, with a large deck that provides both covered and uncovered spaces for relaxation or entertaining and enjoying the expansive views. The lower level also offers a choice of seating areas with easy access to a scenic path leading to Orr Ditch. Perfect for those with an RV, the property includes a detached garage, additional parking, and storage sheds for all your needs. Imagine watching the fireworks from your own home, overlooking the Reno/Sparks skylinethis is a rare opportunity to develop the existing home or create something entirely new in this prime location.
Interior Details
1497
2
2
Has Heating:
Yes
Heating Type:
Forced Air With Air Conditioning
Has Cooling:
Yes
Cooling Type:
Central
Has Fuel:
No
Fuel Type:
N/A
Has Basement:
No
Basement Type:
Finished
Has Flooring:
No
Flooring Type:
N/A
Has Fireplace:
Yes
Fireplace Type:
N/A
Property Details
41817
Yes
Yes
Type:
Garage, Detached
Location:
N/A
Status:
N/A
Number of Spaces:
2
No
No
No
No
Yes
No
No
Construction Details
N/A
Wood
N/A
N/A
Composition Shingle
Tax History
Year
Amount
Land
Improvement
Percent Change
Assessment
2020
$1,101
$30,723
$16,419
--%
$47,142
2019
$1,069
$30,590
$15,528
--%
$46,118
2018
$1,038
$22,943
$14,541
--%
$37,484
2017
$1,008
$22,943
$14,290
--%
$37,233
2016
$982
$22,943
$14,469
--%
$37,412
2014
$952
$12,276
$13,596
--%
$25,872
2012
$955
$13,282
$12,957
--%
$26,239

Average Home Price in 89431
Nearby Properties
Zip Code
Price
Bed
Bath
Sqft
Lot
Sold Date
$500,269
$500,269
3 Beds
2 Baths
1,692 Sqft
11,500 Lot (sqft)
Sold 10/08/2026
$447,846
$447,846
3 Beds
2 Baths
1,354 Sqft
6,229 Lot (sqft)
Sold 05/29/2026
$471,183
$471,183
3 Beds
2 Baths
1,638 Sqft
11,282 Lot (sqft)
Sold 05/21/2026
$497,262
$497,262
3 Beds
2 Baths
1,692 Sqft
6,708 Lot (sqft)
Sold 05/21/2026
$425,181
$425,181
3 Beds
2 Baths
1,672 Sqft
6,882 Lot (sqft)
Sold 10/26/2026
$799,000
$799,000
2 Beds
2 Baths
1,497 Sqft
41,817 Lot (sqft)
Sold 11/02/2026
$450,000
$450,000
3 Beds
1.5 Baths
1,638 Sqft
9,627 Lot (sqft)
Sold 10/27/2026
$397,184
$397,184
3 Beds
2 Baths
1,350 Sqft
6,578 Lot (sqft)
Sold 10/26/2026
$438,185
$438,185
3 Beds
2 Baths
1,414 Sqft
6,011 Lot (sqft)
Sold 10/27/2026