Member Features
Find Real Estate Bargain!
Full foreclosure details
Home value, equity and ownership info
Find homes priced below market
Get full access with a FREE Account
Already a member?
$1,021,924
Sold Price2beds
2baths
1,729sqft
6,574sqft lot
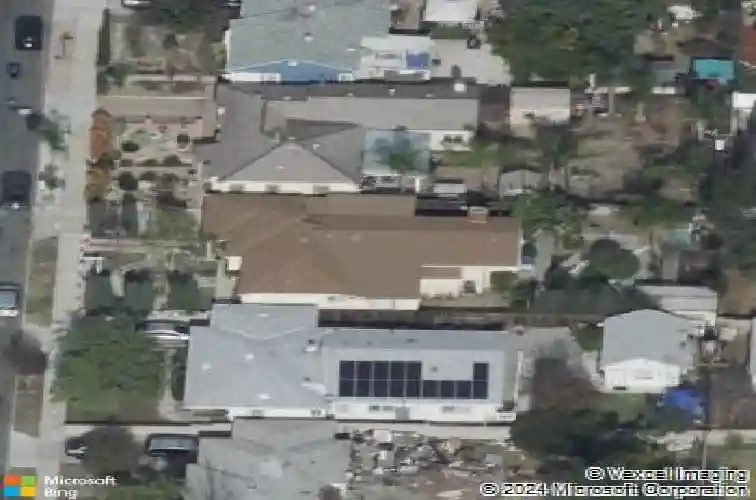
2124 N Pepper St, Burbank, CA 91505
Member Features
Find Real Estate Bargain!
Full foreclosure details
Home value, equity and ownership info
Find homes priced below market
Get full access with a FREE Account
Already a member?
Recently Sold
Off Market
Home type
Price / sqft
Year built
Home Details
Interior Details
1729
2
2
Has Heating:
Yes
Heating Type:
Floor/wall Furnace
Has Cooling:
No
Cooling Type:
N/A
Has Fuel:
No
Fuel Type:
N/A
Has Basement:
No
Basement Type:
N/A
Has Flooring:
No
Flooring Type:
N/A
Has Fireplace:
Yes
Fireplace Type:
N/A
Property Details
6574
Yes
No
Type:
N/A
Location:
N/A
Status:
N/A
Number of Spaces:
N/A
N/A
N/A
N/A
N/A
N/A
N/A
N/A
Construction Details
Conventional
Stucco
N/A
Hip
Composition Shingle
Tax History
Year
Amount
Land
Improvement
Percent Change
Assessment
2019
$4,119
$284,660
$80,203
--%
$364,863
2019
$4,119
$279,079
$78,631
--%
$357,710
2018
$4,022
$273,607
$77,090
--%
$350,697
2017
$3,938
$268,243
$75,579
--%
$343,822
2016
$3,808
$262,984
$74,098
--%
$337,082
2014
$3,728
$253,960
$71,556
--%
$325,516
2013
$3,697
$252,813
$71,233
--%
$324,046
2012
$3,455
$247,856
$69,837
--%
$317,693

Average Home Price in 91505
Nearby Properties
Zip Code
Price
Bed
Bath
Sqft
Lot
Sold Date
$959,718
$959,718
5 Beds
3 Baths
1,634 Sqft
5,993 Lot (sqft)
Sold 10/22/2026
$946,086
$946,086
3 Beds
2 Baths
1,583 Sqft
6,000 Lot (sqft)
Sold 09/16/2026
$1,021,161
$1,021,161
4 Beds
4 Baths
1,619 Sqft
6,000 Lot (sqft)
Sold 06/24/2026
$1,021,924
$1,021,924
2 Beds
2 Baths
1,729 Sqft
6,574 Lot (sqft)
Sold 06/18/2026
$1,198,000
$1,198,000
3 Beds
2 Baths
1,741 Sqft
6,000 Lot (sqft)
Sold 10/13/2026
$1,299,000
$1,299,000
4 Beds
2 Baths
1,770 Sqft
6,000 Lot (sqft)
Sold 10/27/2026
$1,158,176
$1,158,176
3 Beds
2 Baths
1,500 Sqft
6,000 Lot (sqft)
Sold 10/26/2026
$1,110,412
$1,110,412
2 Beds
2 Baths
1,652 Sqft
6,000 Lot (sqft)
Sold 10/26/2026
$1,299,000
$1,299,000
3 Beds
2 Baths
1,572 Sqft
5,951 Lot (sqft)
Sold 10/26/2026
Calculators
Mortgage
Mortgage Calculator
Details for 2124 N PEPPER ST
Property Debt
Foreclosure Contact Details
Similar Homes Nearby

Guides for Pepper St

In August 2024, LA’s pre-foreclosures plummeted 50% from July and 60% from last year, suggesting better economic conditions or successful homeowner interventions. Similar trends in San Jose, while SF and SD remain stable. Sacramento shows significant improvement. LA’s efforts stand out. #HousingMarket #LosAngeles