Member Features
Find Real Estate Bargain!
Full foreclosure details
Home value, equity and ownership info
Find homes priced below market
Get full access with a FREE Account
Already a member?
$613,341
Listing Price2beds
1baths
752sqft
6,013sqft lot
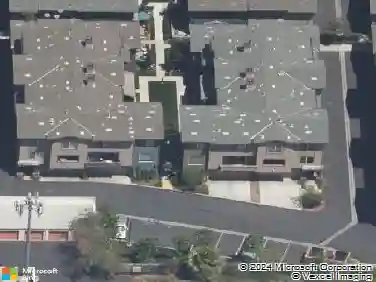
220 N Orange Ave, Azusa, CA 91702
Member Features
Find Real Estate Bargain!
Full foreclosure details
Home value, equity and ownership info
Find homes priced below market
Get full access with a FREE Account
Already a member?
For Sale
Home type
Price / sqft
Year built
Home Details
Interior Details
752
2
1
Has Heating:
Yes
Heating Type:
Floor/wall Furnace
Has Cooling:
No
Cooling Type:
N/A
Has Fuel:
No
Fuel Type:
N/A
Has Basement:
No
Basement Type:
N/A
Has Flooring:
No
Flooring Type:
N/A
Has Fireplace:
Yes
Fireplace Type:
N/A
Property Details
6013
No
No
Type:
N/A
Location:
N/A
Status:
N/A
Number of Spaces:
N/A
N/A
N/A
N/A
N/A
N/A
N/A
N/A
Construction Details
Conventional
Stucco
N/A
Gable
Composition Shingle
Tax History
Year
Amount
Land
Improvement
Percent Change
Assessment
2019
$4,488
$247,053
$113,267
--%
$360,320
2019
$4,488
$242,209
$111,047
--%
$353,256
2018
$4,452
$232,378
$126,645
--%
$359,023
2017
$5,877
$227,822
$124,162
--%
$351,984
2016
$5,756
$223,355
$121,728
--%
$345,083
2014
$3,334
$223,000
$56,000
--%
$279,000
2013
$2,767
$183,000
$46,000
--%
$229,000
2012
$2,817
$153,700
$38,300
--%
$192,000

Average Home Price in 91702
Nearby Properties
Zip Code
Price
Bed
Bath
Sqft
Lot
Sold Date
$627,748
$627,748
2 Beds
1 Baths
849 Sqft
6,015 Lot (sqft)
Sold 09/03/2026
$522,818
$522,818
2 Beds
1 Baths
850 Sqft
5,528 Lot (sqft)
Sold 06/23/2026
$679,205
$679,205
2 Beds
1 Baths
831 Sqft
6,710 Lot (sqft)
Sold 10/27/2026
$613,341
$613,341
2 Beds
1 Baths
752 Sqft
6,013 Lot (sqft)
Sold 10/27/2026
$491,134
$491,134
3 Beds
1 Baths
640 Sqft
3,488 Lot (sqft)
Sold 10/26/2026
Calculators
Mortgage
Mortgage Calculator
Details for 220 N ORANGE AVE
Property Debt
Foreclosure Contact Details
Similar Homes Nearby


Guides for Orange Ave

In August 2024, LA’s pre-foreclosures plummeted 50% from July and 60% from last year, suggesting better economic conditions or successful homeowner interventions. Similar trends in San Jose, while SF and SD remain stable. Sacramento shows significant improvement. LA’s efforts stand out. #HousingMarket #LosAngeles