Member Features
Find Real Estate Bargain!
Full foreclosure details
Home value, equity and ownership info
Find homes priced below market
Get full access with a FREE Account
Already a member?
$563,931
Sold Price3beds
1baths
1,007sqft
6,900sqft lot
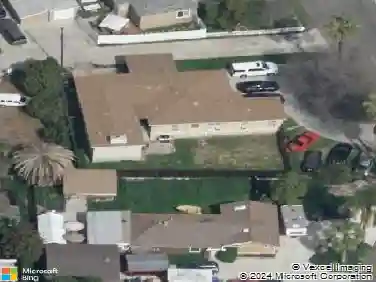
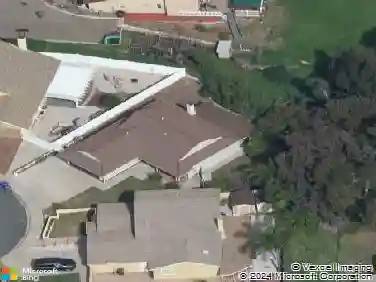
2973 Olive St, Lemon Grove, CA 91945
Member Features
Find Real Estate Bargain!
Full foreclosure details
Home value, equity and ownership info
Find homes priced below market
Get full access with a FREE Account
Already a member?
Recently Sold
Off Market
Home type
Price / sqft
Year built
Home Details
Interior Details
1007
3
1
Has Heating:
No
Heating Type:
N/A
Has Cooling:
No
Cooling Type:
N/A
Has Fuel:
No
Fuel Type:
N/A
Has Basement:
No
Basement Type:
N/A
Has Flooring:
No
Flooring Type:
N/A
Has Fireplace:
Yes
Fireplace Type:
N/A
Property Details
6900
No
No
Type:
Carport (unspecified)
Location:
N/A
Status:
N/A
Number of Spaces:
2
N/A
N/A
N/A
N/A
N/A
N/A
N/A
Construction Details
N/A
N/A
N/A
N/A
N/A
Tax History
Year
Amount
Land
Improvement
Percent Change
Assessment
2020
$1,263
$16,872
$38,209
--%
$55,081
2019
$1,235
$16,542
$37,460
--%
$54,002
2018
$1,204
$16,218
$36,726
--%
$52,944
2017
$1,177
$15,900
$36,006
--%
$51,906
2016
$1,124
$15,589
$35,300
--%
$50,889
2014
$1,087
$15,055
$34,089
--%
$49,144
2013
$1,077
$14,987
$33,935
--%
$48,922
2012
$1,012
$14,694
$33,270
--%
$47,964

Average Home Price in 91945
Nearby Properties
Zip Code
Price
Bed
Bath
Sqft
Lot
Sold Date
$645,247
3 Beds
1 Baths
1,006 Sqft
6,448 Lot (sqft)
Sold 06/25/2026
$755,243
$755,243
4 Beds
2 Baths
1,140 Sqft
9,800 Lot (sqft)
Sold 10/26/2026
$685,000
$685,000
3 Beds
1 Baths
942 Sqft
5,200 Lot (sqft)
Sold 10/13/2026
$581,519
$581,519
3 Beds
1 Baths
1,007 Sqft
6,100 Lot (sqft)
Sold 10/27/2026
$679,000
2 Beds
2 Baths
1,100 Sqft
8,601 Lot (sqft)
Sold 10/05/2026
$566,156
2 Beds
1 Baths
868 Sqft
9,000 Lot (sqft)
Sold 10/27/2026
$1,100,000
$1,100,000
2 Beds
1 Baths
1,052 Sqft
8,100 Lot (sqft)
Sold 10/27/2026
$739,000
$739,000
3 Beds
1 Baths
1,031 Sqft
7,100 Lot (sqft)
Sold 10/26/2026
$795,000
3 Beds
2 Baths
1,149 Sqft
6,100 Lot (sqft)
Sold 10/27/2026
Calculators
Mortgage
Mortgage Calculator
Details for 2973 OLIVE ST
Property Debt
Foreclosure Contact Details
Similar Homes Nearby

Guides for Olive St

San Diego’s average home values have gone up and down; sale prices per square foot showing a trend. Surrounding cities in southern California reflect varied market health, recent data shows.