Member Features
Find Real Estate Bargain!
Full foreclosure details
Home value, equity and ownership info
Find homes priced below market
Get full access with a FREE Account
Already a member?
$348,405
Listing Price4beds
2baths
1,412sqft
43,560sqft lot
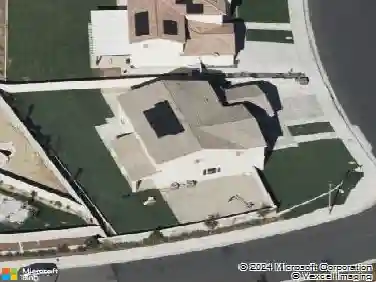
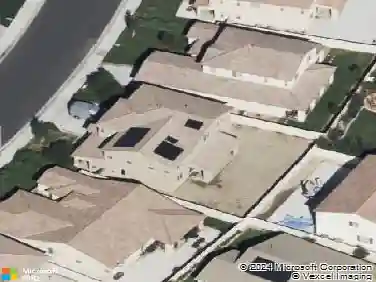
3936 Lindsay St, Jurupa Valley, CA 92509
Member Features
Find Real Estate Bargain!
Full foreclosure details
Home value, equity and ownership info
Find homes priced below market
Get full access with a FREE Account
Already a member?
For Sale
Off Market
Home type
Price / sqft
Year built
Home Details
Interior Details
1412
4
2
Has Heating:
Yes
Heating Type:
Central
Has Cooling:
Yes
Cooling Type:
Central
Has Fuel:
Yes
Fuel Type:
Gas
Has Basement:
No
Basement Type:
N/A
Has Flooring:
No
Flooring Type:
N/A
Has Fireplace:
Yes
Fireplace Type:
N/A
Property Details
43560
Yes
Yes
Type:
Garage, Attached
Location:
N/A
Status:
N/A
Number of Spaces:
2
N/A
N/A
N/A
N/A
N/A
N/A
N/A
Construction Details
N/A
N/A
N/A
N/A
Rock / Gravel
Tax History
Year
Amount
Land
Improvement
Percent Change
Assessment
2020
$2,487
$70,284
$149,212
--%
$219,496
2019
$2,438
$68,906
$146,287
--%
$215,193
2018
$2,360
$67,555
$143,419
--%
$210,974
2017
$2,336
$66,231
$140,607
--%
$206,838
2016
$2,305
$64,933
$137,850
--%
$202,783
2014
$2,118
$62,706
$133,121
--%
$195,827
2013
$2,114
$62,424
$132,520
--%
$194,944
2012
$1,205
$61,200
$51,000
--%
$112,200

Average Home Price in 92509
Nearby Properties
Zip Code
Price
Bed
Bath
Sqft
Lot
Sold Date
$555,952
3 Beds
1.75 Baths
1,260 Sqft
17,860 Lot (sqft)
Sold 09/05/2026
$663,576
3 Beds
2 Baths
1,260 Sqft
20,038 Lot (sqft)
Sold 06/19/2026
$616,446
4 Beds
1.75 Baths
1,585 Sqft
104,108 Lot (sqft)
Sold 05/29/2026
$645,766
4 Beds
2 Baths
1,279 Sqft
10,890 Lot (sqft)
Sold 10/27/2026
$517,256
4 Beds
1.75 Baths
1,396 Sqft
8,276 Lot (sqft)
Sold 10/26/2026
$348,405
4 Beds
2 Baths
1,412 Sqft
43,560 Lot (sqft)
Sold 10/27/2026
$736,328
4 Beds
1.75 Baths
1,285 Sqft
10,454 Lot (sqft)
Sold 10/26/2026