Member Features
Find Real Estate Bargain!
Full foreclosure details
Home value, equity and ownership info
Find homes priced below market
Get full access with a FREE Account
Already a member?
$1,999,950
Listing Price7beds
6baths
1,245sqft
6,658sqft lot
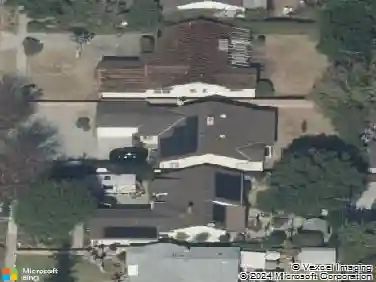
9033 Lindley Ave, Northridge, CA 91325
Member Features
Find Real Estate Bargain!
Full foreclosure details
Home value, equity and ownership info
Find homes priced below market
Get full access with a FREE Account
Already a member?
For Sale
Off Market
Home type
Price / sqft
Year built
Home Details
Interior Details
1245
7
6
Has Heating:
Yes
Heating Type:
Floor/wall Furnace
Has Cooling:
No
Cooling Type:
N/A
Has Fuel:
No
Fuel Type:
N/A
Has Basement:
No
Basement Type:
N/A
Has Flooring:
No
Flooring Type:
N/A
Has Fireplace:
Yes
Fireplace Type:
N/A
Property Details
6658
No
No
Type:
Garage, Attached
Location:
N/A
Status:
N/A
Number of Spaces:
1
N/A
N/A
N/A
N/A
N/A
N/A
N/A
Construction Details
Conventional
Stucco
N/A
Hip
Wood Shingle
Tax History
Year
Amount
Land
Improvement
Percent Change
Assessment
2019
$1,923
$53,245
$79,894
--%
$133,139
2019
$1,923
$52,201
$78,328
--%
$130,529
2018
$1,819
$51,178
$76,793
--%
$127,971
2017
$1,781
$50,175
$75,288
--%
$125,463
2016
$1,732
$49,192
$73,812
--%
$123,004
2014
$1,725
$47,505
$71,280
--%
$118,785
2013
$1,725
$47,291
$70,958
--%
$118,249
2012
$1,702
$46,364
$69,567
--%
$115,931

Average Home Price in 91325
Nearby Properties
Zip Code
Price
Bed
Bath
Sqft
Lot
Sold Date
$811,839
$811,839
3 Beds
2 Baths
1,400 Sqft
9,497 Lot (sqft)
Sold 09/26/2026
$854,801
3 Beds
2 Baths
1,302 Sqft
6,616 Lot (sqft)
Sold 08/03/2026
$810,169
$810,169
3 Beds
1 Baths
1,309 Sqft
7,661 Lot (sqft)
Sold 06/23/2026
$1,999,950
$1,999,950
7 Beds
6 Baths
1,245 Sqft
6,658 Lot (sqft)
Sold 10/26/2026
$839,918
3 Beds
2 Baths
1,281 Sqft
11,279 Lot (sqft)
Sold 10/27/2026
Calculators
Mortgage
Mortgage Calculator
Details for 9033 LINDLEY AVE
Property Debt
Foreclosure Contact Details
Similar Homes Nearby

Guides for Lindley Ave

In August 2024, LA’s pre-foreclosures plummeted 50% from July and 60% from last year, suggesting better economic conditions or successful homeowner interventions. Similar trends in San Jose, while SF and SD remain stable. Sacramento shows significant improvement. LA’s efforts stand out. #HousingMarket #LosAngeles