Member Features
Find Real Estate Bargain!
Full foreclosure details
Home value, equity and ownership info
Find homes priced below market
Get full access with a FREE Account
Already a member?
$767,243
Listing Price2beds
2baths
1,329sqft
7,000sqft lot
171 Lindell Ave, El Cajon, CA 92020
Member Features
Find Real Estate Bargain!
Full foreclosure details
Home value, equity and ownership info
Find homes priced below market
Get full access with a FREE Account
Already a member?
For Sale
Home type
Price / sqft
Year built
Home Details
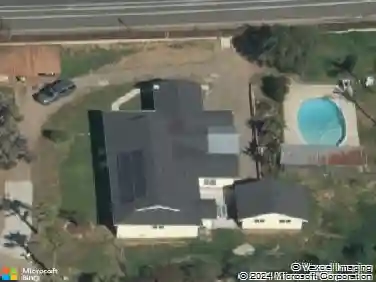
I am excited to share a new property that has just hit the market. This cute one-story home is in a quiet neighborhood and features an amazing backyard with a covered back deck. Property has a variety of fruit trees, including Fuyu Persimmon, Hass Avocado, Meyer Lemon, Navel Orange, White and Red Dragon Fruit, and Mountain Cherry. Additionally, the property includes three versatile outbuildings: a 15x23 finished shed (with great potential for an ADU conversion), a 10x10 finished shed and 10x10 shed used for lawn equipment. The front of the property also features a dry streambed that functions beautifully during heavy rain. Best of all, the home is equipped with solar panels that keep monthly utility payments low, allowing you to run the air conditioning as much as you like.
Interior Details
1329
2
2
Has Heating:
Yes
Heating Type:
Floor/wall Furnace
Has Cooling:
No
Cooling Type:
N/A
Has Fuel:
No
Fuel Type:
N/A
Has Basement:
No
Basement Type:
N/A
Has Flooring:
No
Flooring Type:
N/A
Has Fireplace:
Yes
Fireplace Type:
N/A
Property Details
7000
Yes
Yes
Type:
Carport (unspecified)
Location:
N/A
Status:
N/A
Number of Spaces:
2
N/A
N/A
N/A
N/A
N/A
N/A
N/A
Construction Details
Bungalow
Stucco
N/A
N/A
Composition Shingle
Tax History
Year
Amount
Land
Improvement
Percent Change
Assessment
2020
$4,177
$111,074
$209,547
--%
$320,621
2019
$3,775
$108,897
$205,439
--%
$314,336
2018
$3,712
$106,762
$201,411
--%
$308,173
2017
$3,663
$104,669
$197,462
--%
$302,131
2016
$3,515
$102,617
$193,591
--%
$296,208
2014
$2,926
$99,097
$138,665
--%
$237,762
2013
$2,925
$98,650
$138,039
--%
$236,689
2012
$2,367
$96,716
$135,333
--%
$232,049

Average Home Price in 92020
Nearby Properties
Zip Code
Price
Bed
Bath
Sqft
Lot
Sold Date
$663,954
$663,954
3 Beds
2 Baths
1,260 Sqft
5,477 Lot (sqft)
Sold 10/22/2026
$638,225
$638,225
3 Beds
2 Baths
1,508 Sqft
12,200 Lot (sqft)
Sold 10/16/2026
$737,193
$737,193
3 Beds
2 Baths
1,232 Sqft
6,400 Lot (sqft)
Sold 07/31/2026
$755,000
$755,000
2 Beds
2 Baths
1,157 Sqft
18,122 Lot (sqft)
Sold 07/15/2026
$776,656
$776,656
3 Beds
2 Baths
1,276 Sqft
6,600 Lot (sqft)
Sold 05/26/2026
$717,870
2 Beds
2 Baths
1,475 Sqft
7,100 Lot (sqft)
Sold 10/27/2026
$829,501
$829,501
3 Beds
2 Baths
1,232 Sqft
7,600 Lot (sqft)
Sold 10/27/2026
$710,000
$710,000
3 Beds
2 Baths
1,410 Sqft
11,700 Lot (sqft)
Sold 10/27/2026
$899,000
$899,000
3 Beds
2 Baths
1,464 Sqft
8,600 Lot (sqft)
Sold 10/26/2026
Calculators
Mortgage
Mortgage Calculator
Details for 171 LINDELL AVE
Property Debt
Foreclosure Contact Details
Similar Homes Nearby

Guides for Lindell Ave

San Diego’s average home values have gone up and down; sale prices per square foot showing a trend. Surrounding cities in southern California reflect varied market health, recent data shows.