Member Features
Find Real Estate Bargain!
Full foreclosure details
Home value, equity and ownership info
Find homes priced below market
Get full access with a FREE Account
Already a member?
$728,703
Sold Price3beds
2.5baths
1,400sqft
7,000sqft lot
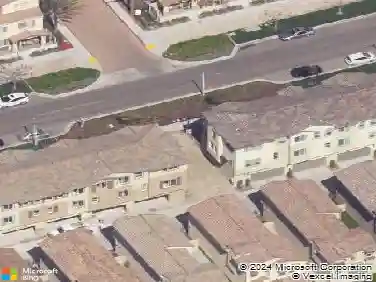
139 L St, Chula Vista, CA 91911
Member Features
Find Real Estate Bargain!
Full foreclosure details
Home value, equity and ownership info
Find homes priced below market
Get full access with a FREE Account
Already a member?
Recently Sold
Off Market
Home type
Price / sqft
Year built
Home Details
Interior Details
1400
3
2.5
Has Heating:
Yes
Heating Type:
Forced Air With Air Conditioning
Has Cooling:
No
Cooling Type:
N/A
Has Fuel:
No
Fuel Type:
N/A
Has Basement:
No
Basement Type:
N/A
Has Flooring:
No
Flooring Type:
N/A
Has Fireplace:
Yes
Fireplace Type:
N/A
Property Details
7000
Yes
Yes
Type:
Carport (unspecified)
Location:
N/A
Status:
N/A
Number of Spaces:
2
N/A
N/A
N/A
N/A
N/A
N/A
N/A
Construction Details
N/A
Block
N/A
N/A
N/A
Tax History
Year
Amount
Land
Improvement
Percent Change
Assessment
2020
$1,809
$83,584
$71,642
--%
$155,226
2019
$1,762
$81,946
$70,238
--%
$152,184
2018
$1,735
$80,340
$68,861
--%
$149,201
2017
$1,699
$78,765
$67,511
--%
$146,276
2016
$1,659
$77,221
$66,188
--%
$143,409
2014
$1,609
$74,573
$63,917
--%
$138,490
2013
$1,607
$74,236
$63,629
--%
$137,865
2012
$1,518
$72,781
$62,382
--%
$135,163

Average Home Price in 91911
Nearby Properties
Zip Code
Price
Bed
Bath
Sqft
Lot
Sold Date
$704,375
4 Beds
2 Baths
1,487 Sqft
7,900 Lot (sqft)
Sold 10/24/2026
$742,134
$742,134
3 Beds
2 Baths
1,525 Sqft
7,700 Lot (sqft)
Sold 10/22/2026
$836,946
$836,946
3 Beds
2 Baths
1,500 Sqft
10,100 Lot (sqft)
Sold 07/07/2026
$853,929
4 Beds
2 Baths
1,525 Sqft
9,400 Lot (sqft)
Sold 06/30/2026
$728,569
$728,569
3 Beds
2 Baths
1,453 Sqft
8,500 Lot (sqft)
Sold 06/10/2026
$789,380
$789,380
3 Beds
2 Baths
1,513 Sqft
10,400 Lot (sqft)
Sold 10/12/2026
$749,889
$749,889
4 Beds
2.5 Baths
1,456 Sqft
7,000 Lot (sqft)
Sold 10/26/2026
$762,697
3 Beds
2 Baths
1,577 Sqft
8,500 Lot (sqft)
Sold 10/26/2026
$879,481
$879,481
3 Beds
1.5 Baths
1,417 Sqft
7,200 Lot (sqft)
Sold 10/27/2026