Member Features
Find Real Estate Bargain!
Full foreclosure details
Home value, equity and ownership info
Find homes priced below market
Get full access with a FREE Account
Already a member?
$495,000
Listing Price--beds
--baths
1,260sqft
1,250sqft lot
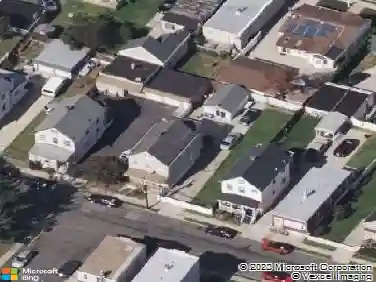
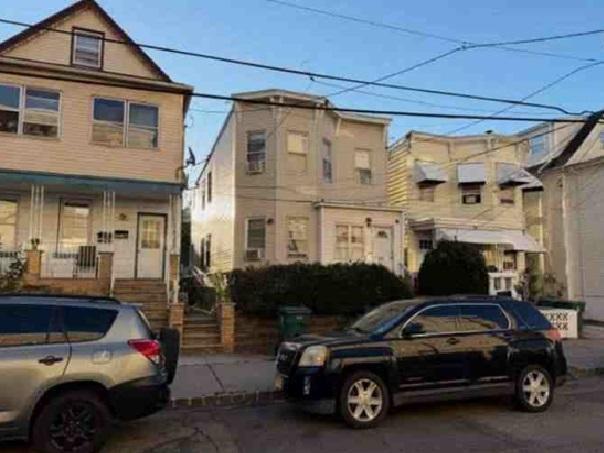
520 Johnstone St, Perth Amboy, NJ 08861
Member Features
Find Real Estate Bargain!
Full foreclosure details
Home value, equity and ownership info
Find homes priced below market
Get full access with a FREE Account
Already a member?
For Sale
Off Market
Home type
Price / sqft
Year built
Home Details
520 Johnston St, Perth Amboy, NJ 08861 Investment Opportunity Turnkey two-family in the heart of Perth Amboy a true set-it-and-forget-it income property. Two spacious 2-bedroom apartments, both occupied by long-term tenants currently on month-to-month leases, giving you immediate cash flow with the flexibility to restructure terms, or take possession of a unit. The standout feature for investors: tenants pay all utilities, including water. That means minimal operating expenses and a clean, predictable NOI a rarity in multi-family at this price point. Location works in your favor. Perth Amboy's waterfront district continues to attract renters, with the NJ Transit station, Route 35, and the Garden State Parkway all close by, plus quick access to NYC. Steady rental demand, strong tenant retention, and a market that keeps appreciating. Whether you're adding to a portfolio, buying your first multi-family, or looking to house-hack one unit while the other pays the mortgage, this is a straightforward, low-maintenance investment worth a serious look. Call today for rent roll and expense details.
Interior Details
1260
N/A
N/A
Has Heating:
No
Heating Type:
N/A
Has Cooling:
No
Cooling Type:
N/A
Has Fuel:
No
Fuel Type:
N/A
Has Basement:
No
Basement Type:
N/A
Has Flooring:
No
Flooring Type:
N/A
Has Fireplace:
Yes
Fireplace Type:
N/A
Property Details
1250
No
No
Type:
N/A
Location:
N/A
Status:
N/A
Number of Spaces:
N/A
N/A
N/A
N/A
N/A
N/A
N/A
N/A
Construction Details
N/A
N/A
N/A
N/A
N/A
Tax History
Year
Amount
Land
Improvement
Percent Change
Assessment
2020
$6,498
$81,500
$136,700
--%
$218,200
2019
$6,522
$81,500
$136,700
--%
$218,200
2018
$6,465
$81,500
$136,700
--%
$218,200
2017
$5,556
$81,500
$106,400
--%
$187,900
2016
$5,411
$81,500
$106,400
--%
$187,900
2013
$5,330
$81,500
$106,400
--%
$187,900
2012
$5,931
$110,000
$113,400
--%
$223,400

Average Home Price in 08861
Nearby Properties
Zip Code
Price
Bed
Bath
Sqft
Lot
Sold Date
$474,597
$474,597
-- Beds
-- Baths
1,449 Sqft
2,500 Lot (sqft)
Sold 10/16/2026
$--
-- Beds
-- Baths
1,440 Sqft
2,500 Lot (sqft)
Sold 09/30/2026
$460,807
$460,807
-- Beds
-- Baths
1,381 Sqft
2,500 Lot (sqft)
Sold 08/26/2026
$420,293
-- Beds
-- Baths
1,272 Sqft
2,052 Lot (sqft)
Sold 07/22/2026
$452,382
$452,382
-- Beds
-- Baths
1,120 Sqft
2,548 Lot (sqft)
Sold 06/18/2026
$306,584
2 Beds
2 Baths
1,118 Sqft
436 Lot (sqft)
Sold 10/26/2026
$430,000
-- Beds
-- Baths
1,411 Sqft
2,500 Lot (sqft)
Sold 10/26/2026
$499,900
-- Beds
-- Baths
1,381 Sqft
2,574 Lot (sqft)
Sold 10/27/2026
$550,000
$550,000
4 Beds
1 Baths
1,182 Sqft
2,801 Lot (sqft)
Sold 10/13/2026