Member Features
Find Real Estate Bargain!
Full foreclosure details
Home value, equity and ownership info
Find homes priced below market
Get full access with a FREE Account
Already a member?
$388,087
Listing Price3beds
2baths
1,049sqft
3,748sqft lot
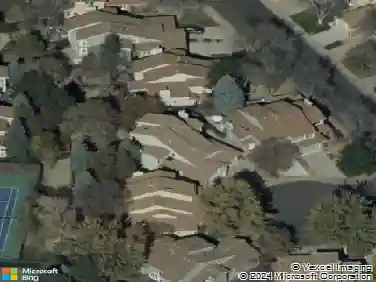
2826 N Jackson St, Denver, CO 80205
Member Features
Find Real Estate Bargain!
Full foreclosure details
Home value, equity and ownership info
Find homes priced below market
Get full access with a FREE Account
Already a member?
For Sale
Off Market
Home type
Price / sqft
Year built
Home Details
Interior Details
1049
3
2
Has Heating:
Yes
Heating Type:
Forced Air With Air Conditioning
Has Cooling:
Yes
Cooling Type:
Central
Has Fuel:
Yes
Fuel Type:
Gas
Has Basement:
No
Basement Type:
No Basement
Has Flooring:
No
Flooring Type:
N/A
Has Fireplace:
Yes
Fireplace Type:
N/A
Property Details
3748
No
No
Type:
Carport (unspecified)
Location:
N/A
Status:
N/A
Number of Spaces:
0
N/A
N/A
N/A
N/A
N/A
N/A
N/A
Construction Details
Row Home
Brick
N/A
N/A
N/A
Tax History
Year
Amount
Land
Improvement
Percent Change
Assessment
2019
$1,802
$10,210
$14,790
--%
$25,000
2019
$1,802
$10,210
$14,790
--%
$25,000
2018
$1,620
$7,710
$13,240
--%
$20,950
2017
$1,615
$7,710
$13,240
--%
$20,950
2016
$1,440
$3,410
$14,260
--%
$17,670
2014
$1,126
$1,990
$11,570
--%
$13,560
2013
$1,126
$1,990
$11,570
--%
$13,560
2011
$971
$1,990
$11,630
--%
$13,620

Average Home Price in 80205
Nearby Properties
Zip Code
Price
Bed
Bath
Sqft
Lot
Sold Date
$485,000
$485,000
2 Beds
2 Baths
1,125 Sqft
741 Lot (sqft)
Sold 10/22/2026
$441,500
$441,500
2 Beds
2 Baths
1,025 Sqft
648 Lot (sqft)
Sold 06/11/2026
$485,000
$485,000
2 Beds
2 Baths
1,025 Sqft
653 Lot (sqft)
Sold 08/20/2026
$388,087
$388,087
3 Beds
2 Baths
1,049 Sqft
3,748 Lot (sqft)
Sold 11/02/2026
$549,000
$549,000
3 Beds
2 Baths
1,056 Sqft
3,135 Lot (sqft)
Sold 10/13/2026
Calculators
Mortgage
Mortgage Calculator
Details for 2826 N JACKSON ST
Property Debt
Foreclosure Contact Details
Similar Homes Nearby


Guides for Jackson St

In August 2024, Denver saw a 15% YoY rise in pre-foreclosures. Aurora had a 71% surge from July. Fort Collins showed stability with just 1 case, while Lakewood doubled YoY. Colorado Springs reported a 10% drop YoY. Each city reveals unique housing dynamics in Colorado.