Member Features
Find Real Estate Bargain!
Full foreclosure details
Home value, equity and ownership info
Find homes priced below market
Get full access with a FREE Account
Already a member?
$1,350,000
Listing Price3beds
2baths
1,531sqft
4,174sqft lot
4907 Island View St, Oxnard, CA 93035
Member Features
Find Real Estate Bargain!
Full foreclosure details
Home value, equity and ownership info
Find homes priced below market
Get full access with a FREE Account
Already a member?
For Sale
Off Market
Home type
Price / sqft
Year built
Home Details
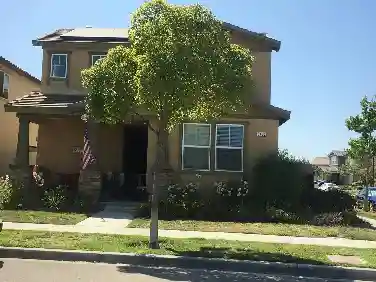
Location, location, location! Welcome to this charming single-story beach bungalow in Mandalay Shores, only one block from the sand. Brimming with vintage character and endless potential, this three-bedroom, two-bath single family home has been lovingly cared for by the same family for more than 40 years. Situated on desirable Island View Street with sidewalks, a front yard, and a cozy back patio, the home also offers a spacious garage with storage and additional parking accessible from Corbina Way--plus plenty of street parking on Island View. Filled with natural light and coastal charm, this sweet home is perfect as a weekend getaway or a full-time beach property. The spacious living area features an oversized rock fireplace, while the kitchen counters and cabinets, bathrooms and nearly all windows have been updated. Additional highlights include a newer furnace, air conditioning, an induction range and tile flooring in the entry and bedrooms. Enjoy daily yoga at Oxnard Beach Park, the Sunday farmers' market at the Channel Islands Harbor, and breathtaking sunsets along the coast. Life at the beach is calling!
Interior Details
1531
3
2
Has Heating:
No
Heating Type:
N/A
Has Cooling:
No
Cooling Type:
N/A
Has Fuel:
No
Fuel Type:
N/A
Has Basement:
No
Basement Type:
N/A
Has Flooring:
No
Flooring Type:
N/A
Has Fireplace:
Yes
Fireplace Type:
N/A
Property Details
4174
No
No
Type:
N/A
Location:
N/A
Status:
N/A
Number of Spaces:
N/A
No
No
No
No
Yes
No
No
Construction Details
N/A
N/A
N/A
N/A
N/A
Tax History
Year
Amount
Land
Improvement
Percent Change
Assessment
2020
$2,710
$121,129
$100,414
--%
$221,543
2019
$2,632
$118,754
$98,446
--%
$217,200
2018
$2,594
$116,426
$96,516
--%
$212,942
2017
$2,461
$114,144
$94,624
--%
$208,768
2016
$2,374
$111,906
$92,769
--%
$204,675
2014
$2,370
$108,068
$89,588
--%
$197,656
2013
$2,377
$107,581
$89,184
--%
$196,765
2012
$2,235
$105,472
$87,436
--%
$192,908

Average Home Price in 93035
Nearby Properties
Zip Code
Price
Bed
Bath
Sqft
Lot
Sold Date
$1,225,924
$1,225,924
3 Beds
2 Baths
1,524 Sqft
4,150 Lot (sqft)
Sold 09/25/2026
$1,177,200
$1,177,200
3 Beds
2 Baths
1,474 Sqft
4,081 Lot (sqft)
Sold 08/12/2026
$1,184,858
$1,184,858
3 Beds
2 Baths
1,612 Sqft
4,156 Lot (sqft)
Sold 07/23/2026
$1,695,000
$1,695,000
4 Beds
2 Baths
1,470 Sqft
4,080 Lot (sqft)
Sold 10/05/2026
$1,350,000
$1,350,000
3 Beds
2 Baths
1,531 Sqft
4,174 Lot (sqft)
Sold 10/13/2026
$1,672,829
$1,672,829
3 Beds
2 Baths
1,670 Sqft
4,060 Lot (sqft)
Sold 10/27/2026
$1,650,000
$1,650,000
2 Beds
2 Baths
1,517 Sqft
4,060 Lot (sqft)
Sold 10/27/2026
$1,699,000
$1,699,000
3 Beds
4 Baths
1,695 Sqft
4,100 Lot (sqft)
Sold 10/05/2026
$1,375,000
$1,375,000
3 Beds
2 Baths
1,555 Sqft
4,200 Lot (sqft)
Sold 10/26/2026