Member Features
Find Real Estate Bargain!
Full foreclosure details
Home value, equity and ownership info
Find homes priced below market
Get full access with a FREE Account
Already a member?
$1,671,629
Listing Price3beds
2.5baths
2,138sqft
9,960sqft lot
102 Fiesta Cir, Orinda, CA 94563
Member Features
Find Real Estate Bargain!
Full foreclosure details
Home value, equity and ownership info
Find homes priced below market
Get full access with a FREE Account
Already a member?
For Sale
Off Market
Home type
Price / sqft
Year built
Home Details
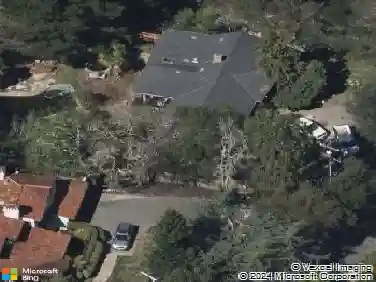
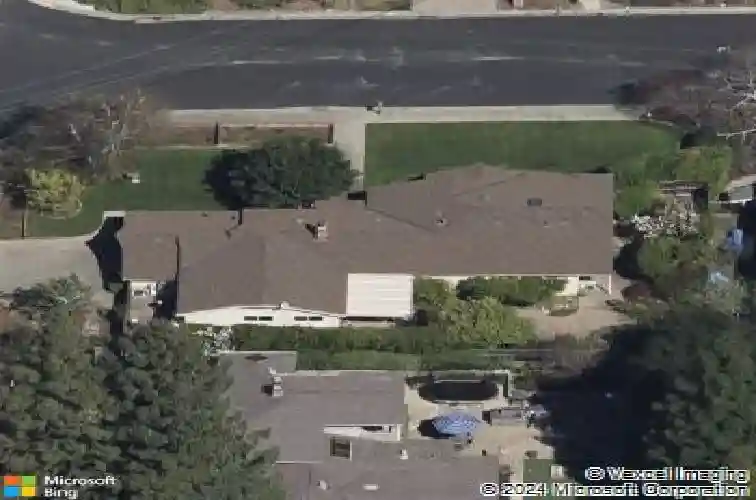
A rare corner-lot gem in Orindas beloved Ivy Drive neighborhood, offered for the very first time. Everyones favorite dog-walking, stroller-pushing, neighbor-waving community, this 3-bed, 2.5-bath ranch-style home carries the kind of warmth that only comes from a life genuinely well-lived. Lush, manicured .23 acres set the tone: mature trees, blooming roses, and a wide lawn that practically invites a game of catch. Inside, soaring vaulted wood-beam ceilings, a picture window, and a classic brick fireplace anchor the living room. The kitchen flows into a sun-filled family room, where coffered ceilings and sliding glass doors opening to a backyard make it the heart of the home. The primary suite opens to the garden, and two additional sunny bedrooms offer all the room a growing family needs. Walk to Del Rey Elementary, Orinda Intermediate, and Miramonte High School. Once people find Ivy Drive, they dont leave.
Interior Details
2138
3
2.5
Has Heating:
No
Heating Type:
N/A
Has Cooling:
No
Cooling Type:
N/A
Has Fuel:
No
Fuel Type:
N/A
Has Basement:
No
Basement Type:
N/A
Has Flooring:
No
Flooring Type:
N/A
Has Fireplace:
Yes
Fireplace Type:
N/A
Property Details
9960
No
No
Type:
Garage, Attached
Location:
N/A
Status:
N/A
Number of Spaces:
2
N/A
N/A
N/A
N/A
N/A
N/A
N/A
Construction Details
N/A
N/A
N/A
N/A
N/A
Tax History
Year
Amount
Land
Improvement
Percent Change
Assessment
2020
$2,464
$47,042
$95,467
--%
$142,509
2019
$2,971
$46,120
$93,596
--%
$139,716
2018
$2,802
$45,216
$91,761
--%
$136,977
2017
$2,696
$44,330
$89,962
--%
$134,292
2016
$2,622
$43,461
$88,199
--%
$131,660
2014
$2,758
$41,971
$85,174
--%
$127,145
2013
$2,695
$41,782
$84,790
--%
$126,572
2012
$2,573
$40,963
$83,128
--%
$124,091

Average Home Price in 94563
Nearby Properties
Zip Code
Price
Bed
Bath
Sqft
Lot
Sold Date
$1,744,434
$1,744,434
4 Beds
3 Baths
1,942 Sqft
11,790 Lot (sqft)
Sold 10/27/2026
$1,626,556
$1,626,556
4 Beds
3.5 Baths
1,992 Sqft
10,890 Lot (sqft)
Sold 10/22/2026
$2,074,599
$2,074,599
4 Beds
2.5 Baths
2,457 Sqft
25,680 Lot (sqft)
Sold 09/01/2026
$1,992,011
$1,992,011
4 Beds
2.5 Baths
1,975 Sqft
18,320 Lot (sqft)
Sold 10/26/2026
$1,580,000
$1,580,000
4 Beds
2 Baths
2,038 Sqft
17,000 Lot (sqft)
Sold 09/29/2026
$1,298,000
$1,298,000
4 Beds
2 Baths
2,142 Sqft
14,950 Lot (sqft)
Sold 10/27/2026
$1,880,000
$1,880,000
4 Beds
3 Baths
2,372 Sqft
18,450 Lot (sqft)
Sold 10/26/2026
$1,720,001
$1,720,001
4 Beds
2 Baths
2,358 Sqft
17,000 Lot (sqft)
Sold 10/13/2026
$1,671,629
$1,671,629
3 Beds
2.5 Baths
2,138 Sqft
9,960 Lot (sqft)
Sold 10/26/2026