Member Features
Find Real Estate Bargain!
Full foreclosure details
Home value, equity and ownership info
Find homes priced below market
Get full access with a FREE Account
Already a member?
$1,020,000
Listing Price4beds
3baths
2,585sqft
6,224sqft lot
843 DE LA Toba Rd, Chula Vista, CA 91911
Member Features
Find Real Estate Bargain!
Full foreclosure details
Home value, equity and ownership info
Find homes priced below market
Get full access with a FREE Account
Already a member?
For Sale
Off Market
Home type
Price / sqft
Year built
Home Details
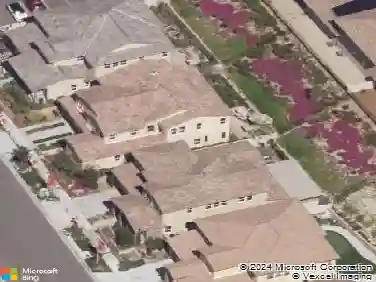
Only two owners since construction, this well-loved home sits in the heart of Phase 2 of the Sunbow neighborhood, one of East Chula Vistas most desirable communities. Enjoy easy freeway access, proximity to award-winning schools, a community rec center, grocery stores, and popular restaurantsall just minutes away. Durable Luxury Vinyl Plank (LVP) flooring throughout. No HOA fees more freedom, fewer costs. Spacious driveway fits a camper perfect for adventurers. Low-maintenance turf in the front yard & a fully hardscaped backyard. Dedicated laundry room with sink on the first floor. Kitchen and bathrooms ready for your personal touch and creative vision. This home offers not just a place to live, but a lifestylenestled in a neighborhood known for its tranquility, convenience, and strong sense of community. Whether youre a first-time buyer or looking to upgrade, this is a space where your dreams can take root. $1,975 of MELLO ROOS ENDS 2028.
Interior Details
2585
4
3
Has Heating:
No
Heating Type:
N/A
Has Cooling:
No
Cooling Type:
N/A
Has Fuel:
No
Fuel Type:
N/A
Has Basement:
No
Basement Type:
N/A
Has Flooring:
No
Flooring Type:
N/A
Has Fireplace:
Yes
Fireplace Type:
N/A
Property Details
6224
No
No
Type:
N/A
Location:
N/A
Status:
N/A
Number of Spaces:
N/A
N/A
N/A
N/A
N/A
N/A
N/A
N/A
Construction Details
N/A
N/A
N/A
N/A
N/A
Tax History
Year
Amount
Land
Improvement
Percent Change
Assessment
2020
$8,293
$238,438
$238,438
--%
$476,876
2019
$8,115
$233,763
$233,763
--%
$467,526
2018
$7,977
$229,180
$229,180
--%
$458,360
2017
$7,840
$224,687
$224,687
--%
$449,374
2016
$7,664
$220,282
$220,282
--%
$440,564
2013
$7,449
$212,724
$212,724
--%
$425,448
2013
$7,449
$211,763
$211,763
--%
$423,526
2012
$7,329
$207,611
$207,611
--%
$415,222

Average Home Price in 91911
Nearby Properties
Zip Code
Price
Bed
Bath
Sqft
Lot
Sold Date
$1,101,904
$1,101,904
4 Beds
2.5 Baths
2,407 Sqft
7,764 Lot (sqft)
Sold 10/30/2026
$1,094,417
$1,094,417
4 Beds
2.5 Baths
2,407 Sqft
7,408 Lot (sqft)
Sold 09/26/2026
$1,207,080
$1,207,080
4 Beds
3.5 Baths
2,956 Sqft
8,893 Lot (sqft)
Sold 08/28/2026
$1,114,406
$1,114,406
4 Beds
2.5 Baths
2,728 Sqft
6,599 Lot (sqft)
Sold 06/25/2026
$1,204,153
$1,204,153
4 Beds
3.5 Baths
2,956 Sqft
8,162 Lot (sqft)
Sold 06/16/2026
$993,360
$993,360
3 Beds
2.5 Baths
2,498 Sqft
6,620 Lot (sqft)
Sold 10/26/2026
$1,328,131
$1,328,131
3 Beds
3.5 Baths
2,956 Sqft
9,461 Lot (sqft)
Sold 10/13/2026
$896,365
4 Beds
2.5 Baths
2,585 Sqft
8,843 Lot (sqft)
Sold 10/26/2026
$1,007,188
$1,007,188
5 Beds
3 Baths
2,608 Sqft
4,617 Lot (sqft)
Sold 10/27/2026