Member Features
Find Real Estate Bargain!
Full foreclosure details
Home value, equity and ownership info
Find homes priced below market
Get full access with a FREE Account
Already a member?
$1,121,906
Listing Price4beds
2.5baths
1,454sqft
4,840sqft lot
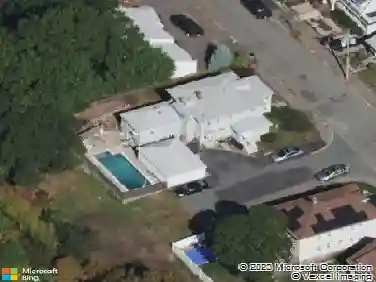
44 Chickatabot Rd, Quincy, MA 02169
Member Features
Find Real Estate Bargain!
Full foreclosure details
Home value, equity and ownership info
Find homes priced below market
Get full access with a FREE Account
Already a member?
For Sale
Off Market
Home type
Price / sqft
Year built
Home Details
**Weekend Open Houses Canceled** Steps from private and public beaches in Merrymount, one of Quincys most desirable coastal neighborhoods, this completely transformed 4-bedroom, 2.5-bath Colonial blends modern comfort with beach-town charm. After 15+ years of ownership, the sellers completed a total makeover inside and out. The result is one of the neighborhoods standout homes - finished living space across three levels, including a mostly finished basement. The open-concept kitchen features a large peninsula, perfect for entertaining and conversation. Central air conditioning keeps the home comfortable year-round. Outside shines with new hardscaping and stonework, a paver patio and driveway, an outdoor shower for beach days, a stone fire pit for evening gatherings, and a fully fenced yard ideal for families and pets. Detached storage garage included. Merrymount isnt just a neighborhood - its a lifestyle. Enjoy coastal walks, community events, and relaxed beach vibes daily.
Interior Details
1454
4
2.5
Has Heating:
Yes
Heating Type:
Hot Water
Has Cooling:
No
Cooling Type:
N/A
Has Fuel:
Yes
Fuel Type:
Oil
Has Basement:
No
Basement Type:
Full
Has Flooring:
No
Flooring Type:
N/A
Has Fireplace:
Yes
Fireplace Type:
N/A
Property Details
4840
No
No
Type:
N/A
Location:
N/A
Status:
N/A
Number of Spaces:
N/A
N/A
N/A
N/A
N/A
N/A
N/A
N/A
Construction Details
Colonial
Wood Siding
N/A
Gable
Asphalt
Tax History
Year
Amount
Land
Improvement
Percent Change
Assessment
2020
$5,973
$230,000
$250,500
--%
$480,500
2019
$5,699
$215,000
$239,100
--%
$454,100
2018
$5,335
$178,500
$221,400
--%
$399,900
2017
$5,502
$187,000
$201,300
--%
$388,300
2016
$5,349
$183,600
$188,900
--%
$372,500
2014
$4,709
$168,000
$148,900
--%
$316,900
2013
$4,566
$168,000
$146,900
--%
$314,900

Average Home Price in 02169
Nearby Properties
Zip Code
Price
Bed
Bath
Sqft
Lot
Sold Date
$719,068
$719,068
3 Beds
1.5 Baths
1,298 Sqft
4,360 Lot (sqft)
Sold 09/01/2026
$615,406
4 Beds
1 Baths
1,654 Sqft
5,478 Lot (sqft)
Sold 08/06/2026
$725,000
$725,000
3 Beds
1.5 Baths
1,520 Sqft
5,152 Lot (sqft)
Sold 10/27/2026
$875,000
$875,000
3 Beds
2 Baths
1,557 Sqft
5,852 Lot (sqft)
Sold 10/27/2026
$889,003
$889,003
3 Beds
2 Baths
1,438 Sqft
5,000 Lot (sqft)
Sold 10/27/2026
$799,000
$799,000
4 Beds
3 Baths
1,650 Sqft
4,952 Lot (sqft)
Sold 10/13/2026
$916,646
$916,646
4 Beds
2.5 Baths
1,413 Sqft
6,260 Lot (sqft)
Sold 10/27/2026
$825,000
$825,000
3 Beds
3 Baths
1,664 Sqft
4,952 Lot (sqft)
Sold 10/13/2026
$781,340
$781,340
3 Beds
3 Baths
1,560 Sqft
6,883 Lot (sqft)
Sold 10/27/2026