Member Features
Find Real Estate Bargain!
Full foreclosure details
Home value, equity and ownership info
Find homes priced below market
Get full access with a FREE Account
Already a member?
$714,866
Listing Price3beds
2baths
1,595sqft
6,500sqft lot
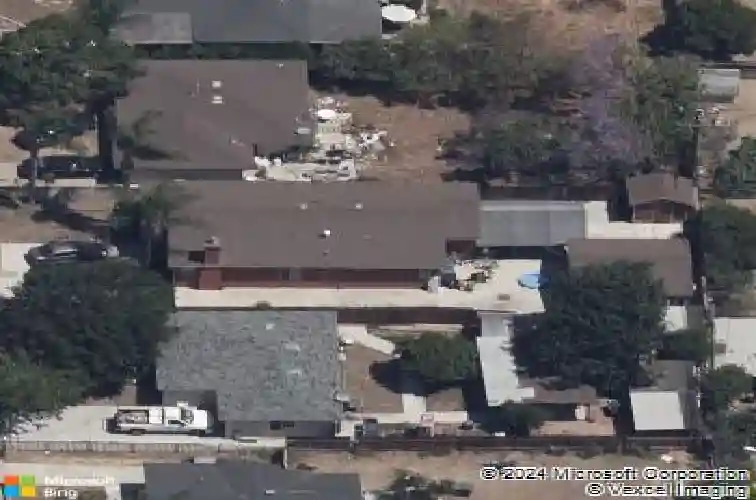
1023 S Bon View Ave, Ontario, CA 91761
Member Features
Find Real Estate Bargain!
Full foreclosure details
Home value, equity and ownership info
Find homes priced below market
Get full access with a FREE Account
Already a member?
For Sale
Off Market
Home type
Price / sqft
Year built
Home Details
Interior Details
1595
3
2
Has Heating:
Yes
Heating Type:
Central
Has Cooling:
Yes
Cooling Type:
Central
Has Fuel:
No
Fuel Type:
N/A
Has Basement:
No
Basement Type:
N/A
Has Flooring:
No
Flooring Type:
N/A
Has Fireplace:
Yes
Fireplace Type:
N/A
Property Details
6500
Yes
Yes
Type:
Garage, Detached
Location:
N/A
Status:
N/A
Number of Spaces:
2
No
Yes
No
No
No
No
No
Construction Details
Modern
N/A
N/A
N/A
Composition Shingle
Tax History
Year
Amount
Land
Improvement
Percent Change
Assessment
2020
$5,202
$168,000
$311,877
--%
$479,877
2019
$5,105
$162,700
$303,200
--%
$465,900
2018
$5,135
$162,700
$303,200
--%
$465,900
2017
$4,716
$152,100
$283,400
--%
$435,500
2016
$4,398
$144,900
$269,900
--%
$414,800
2014
$3,272
$109,000
$202,000
--%
$311,000
2013
$2,657
$88,000
$162,000
--%
$250,000
2012
$1,652
$60,000
$100,000
--%
$160,000

Average Home Price in 91761
Nearby Properties
Zip Code
Price
Bed
Bath
Sqft
Lot
Sold Date
$769,298
$769,298
4 Beds
2 Baths
1,470 Sqft
5,249 Lot (sqft)
Sold 09/23/2026
$709,900
$709,900
3 Beds
2 Baths
1,807 Sqft
5,544 Lot (sqft)
Sold 09/29/2026
$714,866
$714,866
3 Beds
2 Baths
1,595 Sqft
6,500 Lot (sqft)
Sold 10/13/2026
$635,079
$635,079
5 Beds
1 Baths
1,773 Sqft
6,080 Lot (sqft)
Sold NaN/NaN/NaN
Calculators
Mortgage
Mortgage Calculator
Details for 1023 S BON VIEW AVE
Property Debt
Foreclosure Contact Details
Similar Homes Nearby


Guides for Bon View Ave

San Bernardino’s real estate values rose steadily in early to mid-2024, with average property values peaking at $500K in May. Sale prices per sq. ft also increased modestly despite a subtle decrease in number of properties sold. Comparison with nearby cities shows varied market trends.