Member Features
Find Real Estate Bargain!
Full foreclosure details
Home value, equity and ownership info
Find homes priced below market
Get full access with a FREE Account
Already a member?
$1,609,726
Listing Price3beds
2baths
2,209sqft
15,943sqft lot
739 Anchor Dr, Sanibel, FL 33957
Member Features
Find Real Estate Bargain!
Full foreclosure details
Home value, equity and ownership info
Find homes priced below market
Get full access with a FREE Account
Already a member?
For Sale
Home type
Price / sqft
Year built
Home Details
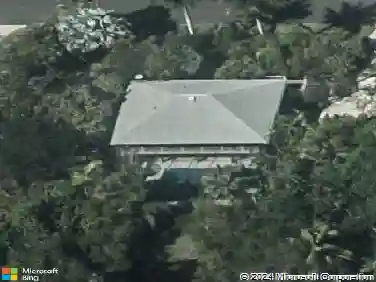
Driving up to this property you immediately notice the brick paved park-like road. It leads to a secluded home on an oversized lot that resembles a botanical garden. Blooming hibiscus, ginger, jasmine and fragrant gardenia surround this raised home on the sought after east end. As you enter the open living and dining room with raised ceilings you are greeted by a wood burning fireplace all nestled next to an open kitchen with granite counter tops and new appliances, including an induction stove that cooks like gas. Deeded beach access a short walk away, 10,000lb boat lift and a private kayak launch flank a beautiful pool with outdoor grill area. A large open-covered deck overlooking pool and mangrove lined canal plus roof top solar panels tied to the grid where the electric company pays you for electricity. This home is truly one of a kind.
Interior Details
2209
3
2
Has Heating:
Yes
Heating Type:
Forced Air With Air Conditioning
Has Cooling:
Yes
Cooling Type:
Central
Has Fuel:
Yes
Fuel Type:
Electric
Has Basement:
No
Basement Type:
N/A
Has Flooring:
No
Flooring Type:
Carpet
Has Fireplace:
Yes
Fireplace Type:
N/A
Property Details
15943
No
No
Type:
Garage, Attached
Location:
N/A
Status:
N/A
Number of Spaces:
4
No
No
No
No
Yes
No
No
Construction Details
Ranch
Aluminum/vinyl
N/A
Cathedral/clerestory
Metal
Tax History
Year
Amount
Land
Improvement
Percent Change
Assessment
2020
$11,500
$396,500
$371,448
--%
$767,948
2019
$11,803
$388,100
$395,970
--%
$784,070
2018
$12,104
$388,100
$401,645
--%
$789,745
2017
$12,229
$352,800
$438,538
--%
$791,338
2016
$11,222
$352,800
$349,099
--%
$701,899
2014
$11,298
$0
$0
--%
$681,103
2013
$11,171
$0
$0
--%
$659,522
2012
$12,025
$0
$0
--%
$744,042

Average Home Price in 33957
Nearby Properties
Zip Code
Price
Bed
Bath
Sqft
Lot
Sold Date
$--
3 Beds
2 Baths
2,372 Sqft
16,727 Lot (sqft)
Sold 09/30/2026
$1,159,782
$1,159,782
2 Beds
3 Baths
2,249 Sqft
16,466 Lot (sqft)
Sold 08/26/2026
$1,249,000
$1,249,000
3 Beds
2 Baths
2,435 Sqft
17,860 Lot (sqft)
Sold 05/26/2026
$1,113,256
$1,113,256
3 Beds
2 Baths
1,999 Sqft
19,079 Lot (sqft)
Sold 10/27/2026
$1,541,396
$1,541,396
3 Beds
3.5 Baths
2,340 Sqft
10,716 Lot (sqft)
Sold 10/27/2026
$2,750,000
$2,750,000
4 Beds
3 Baths
2,496 Sqft
21,300 Lot (sqft)
Sold 10/27/2026
$1,274,206
$1,274,206
4 Beds
3 Baths
1,944 Sqft
11,064 Lot (sqft)
Sold 10/26/2026
$1,609,726
$1,609,726
3 Beds
2 Baths
2,209 Sqft
15,943 Lot (sqft)
Sold 10/27/2026
$895,770
$895,770
3 Beds
2 Baths
2,504 Sqft
12,632 Lot (sqft)
Sold 10/27/2026