Member Features
Find Real Estate Bargain!
Full foreclosure details
Home value, equity and ownership info
Find homes priced below market
Get full access with a FREE Account
Already a member?
$4,037,605
Listing Price3beds
2baths
2,131sqft
10,010sqft lot
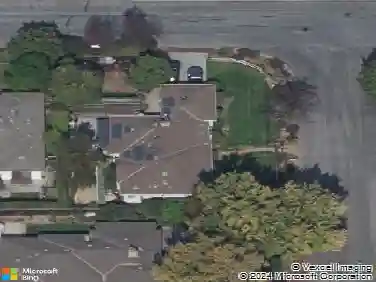
83 Almond Ave, Los Altos, CA 94022
Member Features
Find Real Estate Bargain!
Full foreclosure details
Home value, equity and ownership info
Find homes priced below market
Get full access with a FREE Account
Already a member?
For Sale
Off Market
Home type
Price / sqft
Year built
Home Details
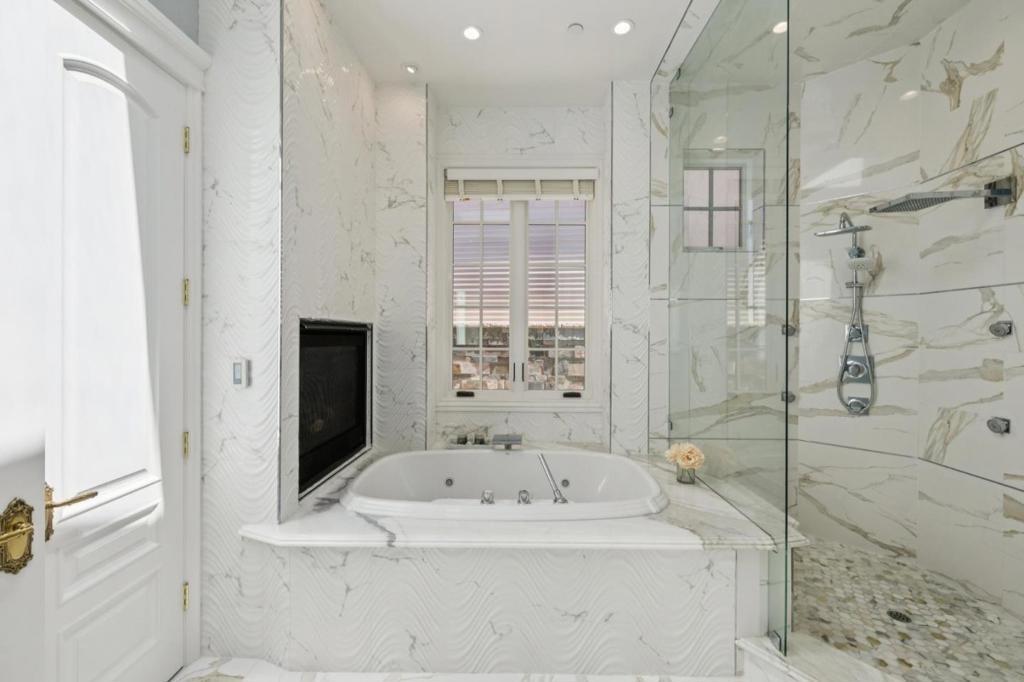
Immaculate! Ready to move right in! Granite kitchen, custom cabinets, stainless appliances, built-in over, and gas cooktop with hood; double pane windows throughout, beautiful remodeled baths, hardwood floors, custom doors, new interior paint, and new carpeting; Excellent floorplan with a formal entry, open breakfast room, adjacent family room, laundry room, dining, and living rooms, and a separate quiet home office with a separate entry, ideal for private conference calls, un-interrupted work, or loud teens! Big quiet backyard with an entertainers patio for outdoor dining and grass for the kids to play. Prime location--walk steps to charming downtown Los Altos, groceries, restaurants, and to Los Altos High, a little further to top-rated Almond Elementary, and an easy bike ride to Egan Middle! Bike to Caltrain, Google, Apple, Meta, Intuit, Nvidia, and to ALL of the great companies; do not miss this one!
Interior Details
2131
3
2
Has Heating:
Yes
Heating Type:
Yes
Has Cooling:
No
Cooling Type:
N/A
Has Fuel:
No
Fuel Type:
N/A
Has Basement:
No
Basement Type:
N/A
Has Flooring:
No
Flooring Type:
N/A
Has Fireplace:
Yes
Fireplace Type:
N/A
Property Details
10010
Yes
Yes
Type:
N/A
Location:
N/A
Status:
N/A
Number of Spaces:
N/A
No
No
No
No
Yes
No
No
Construction Details
H-shape
Stucco
N/A
N/A
Wood Shingle
Tax History
Year
Amount
Land
Improvement
Percent Change
Assessment
2020
$5,820
$182,729
$223,340
--%
$406,069
2019
$5,349
$179,147
$218,961
--%
$398,108
2018
$5,117
$175,635
$214,668
--%
$390,303
2017
$4,942
$172,192
$210,459
--%
$382,651
2016
$4,912
$168,816
$206,333
--%
$375,149
2014
$5,250
$163,024
$199,253
--%
$362,277
2013
$4,670
$162,288
$198,353
--%
$360,641
2012
$4,460
$159,106
$194,464
--%
$353,570

Average Home Price in 94022
Nearby Properties
Zip Code
Price
Bed
Bath
Sqft
Lot
Sold Date
$3,900,000
$3,900,000
4 Beds
2.5 Baths
2,405 Sqft
11,400 Lot (sqft)
Sold 10/14/2026
$3,946,173
$3,946,173
3 Beds
3 Baths
2,050 Sqft
10,280 Lot (sqft)
Sold 09/22/2026
$5,799,413
$5,799,413
3 Beds
3 Baths
1,992 Sqft
13,000 Lot (sqft)
Sold 08/12/2026
$4,835,140
$4,835,140
4 Beds
2.5 Baths
2,293 Sqft
9,880 Lot (sqft)
Sold 07/10/2026
$5,020,183
$5,020,183
4 Beds
2.5 Baths
2,312 Sqft
10,440 Lot (sqft)
Sold 07/07/2026
$4,755,771
$4,755,771
3 Beds
3 Baths
2,063 Sqft
9,563 Lot (sqft)
Sold 06/17/2026
$4,950,000
$4,950,000
4 Beds
3 Baths
2,426 Sqft
16,100 Lot (sqft)
Sold 10/13/2026
$4,815,599
$4,815,599
5 Beds
2.5 Baths
2,201 Sqft
9,975 Lot (sqft)
Sold 10/26/2026
$5,653,246
$5,653,246
4 Beds
2.5 Baths
2,403 Sqft
11,070 Lot (sqft)
Sold 10/26/2026