Member Features
Find Real Estate Bargain!
Full foreclosure details
Home value, equity and ownership info
Find homes priced below market
Get full access with a FREE Account
Already a member?
$1,036,285
Listing Price4beds
3baths
2,048sqft
5,735sqft lot
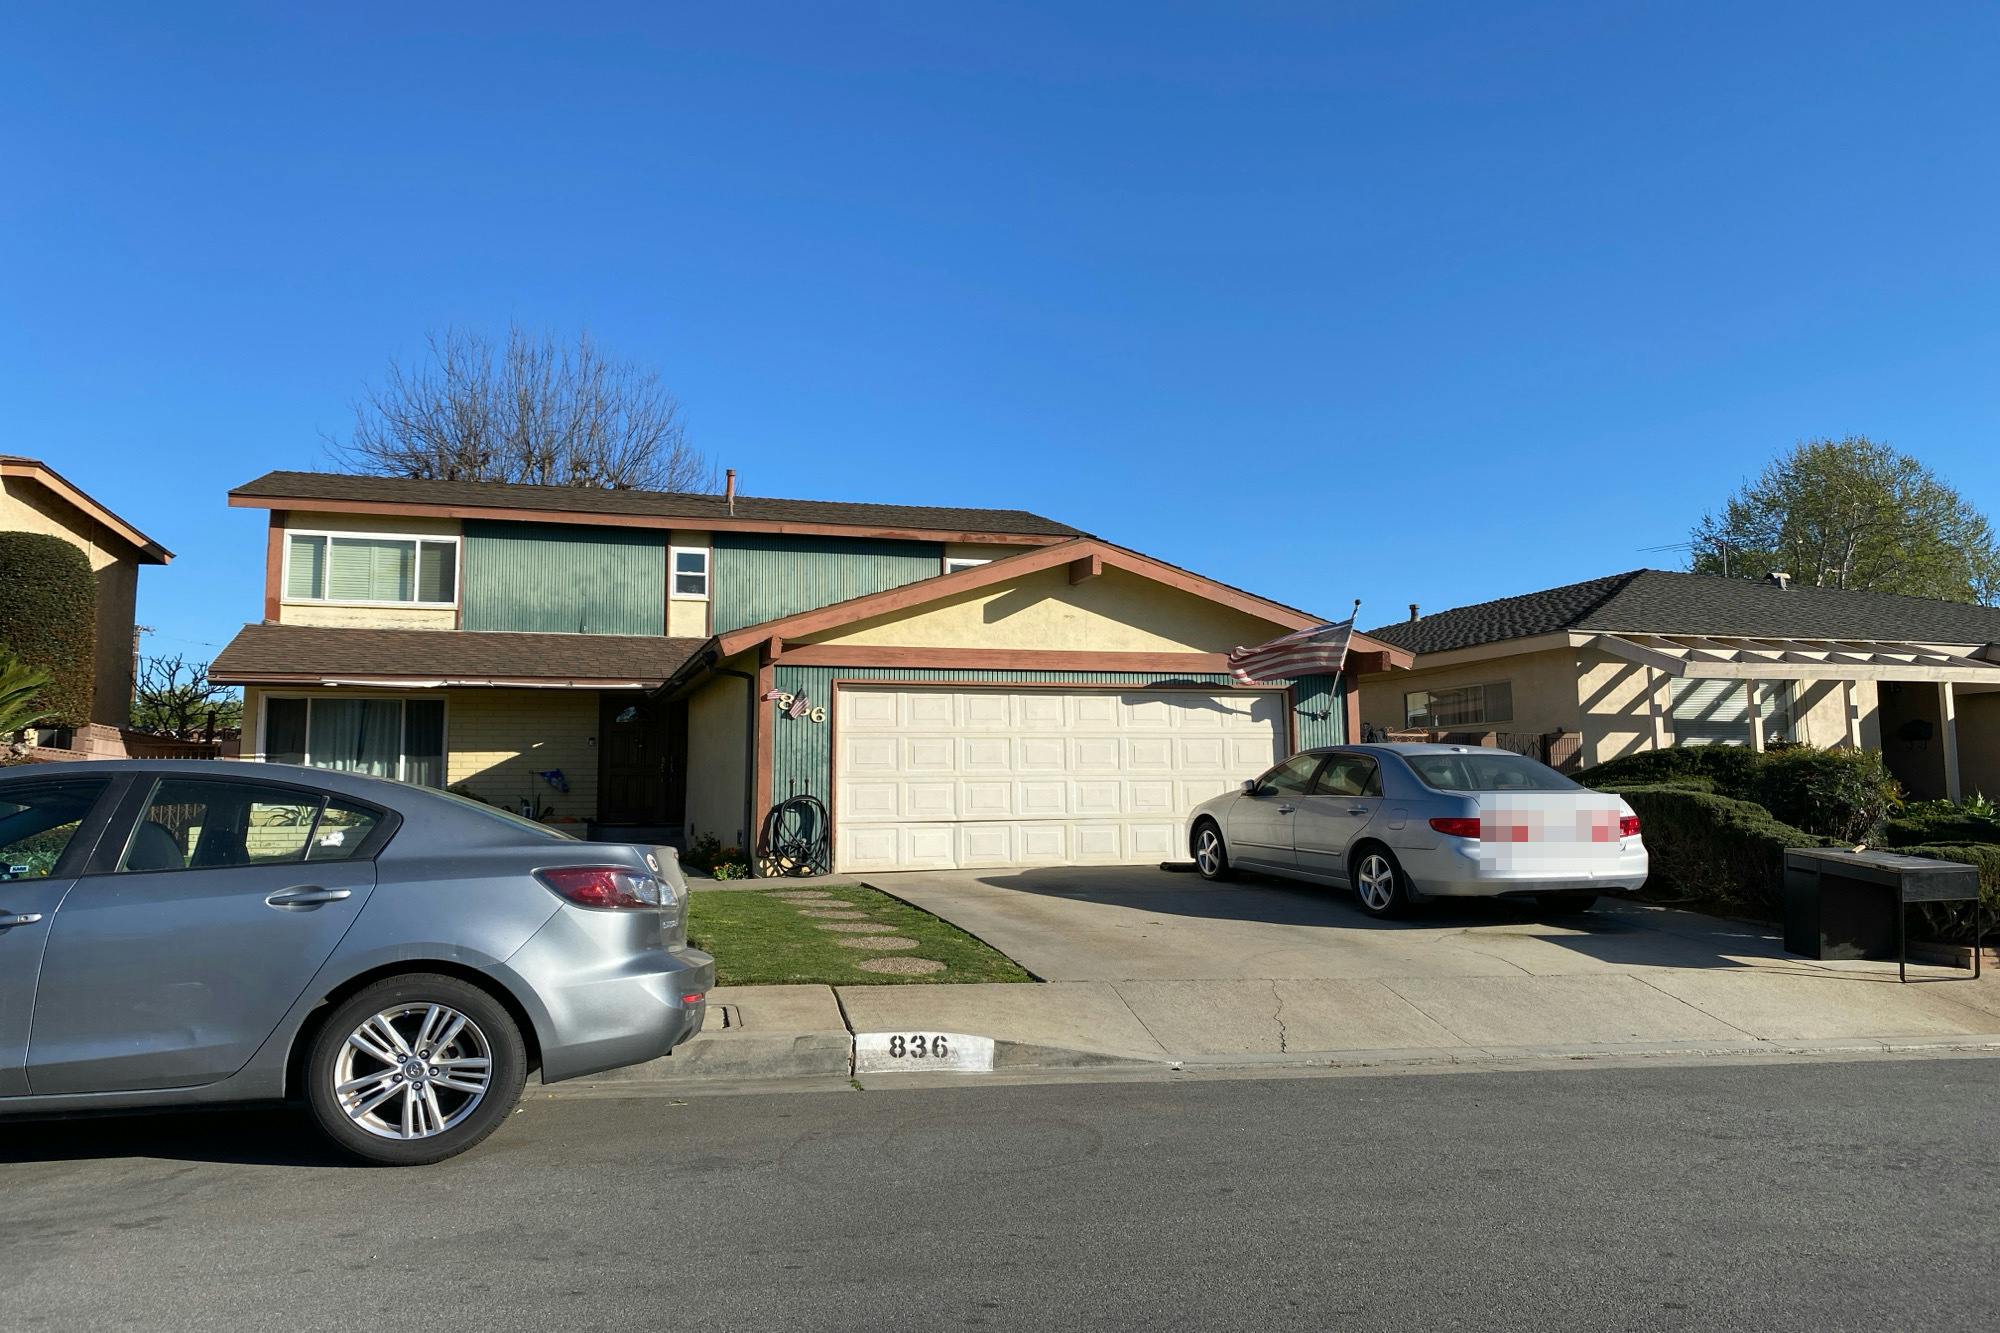
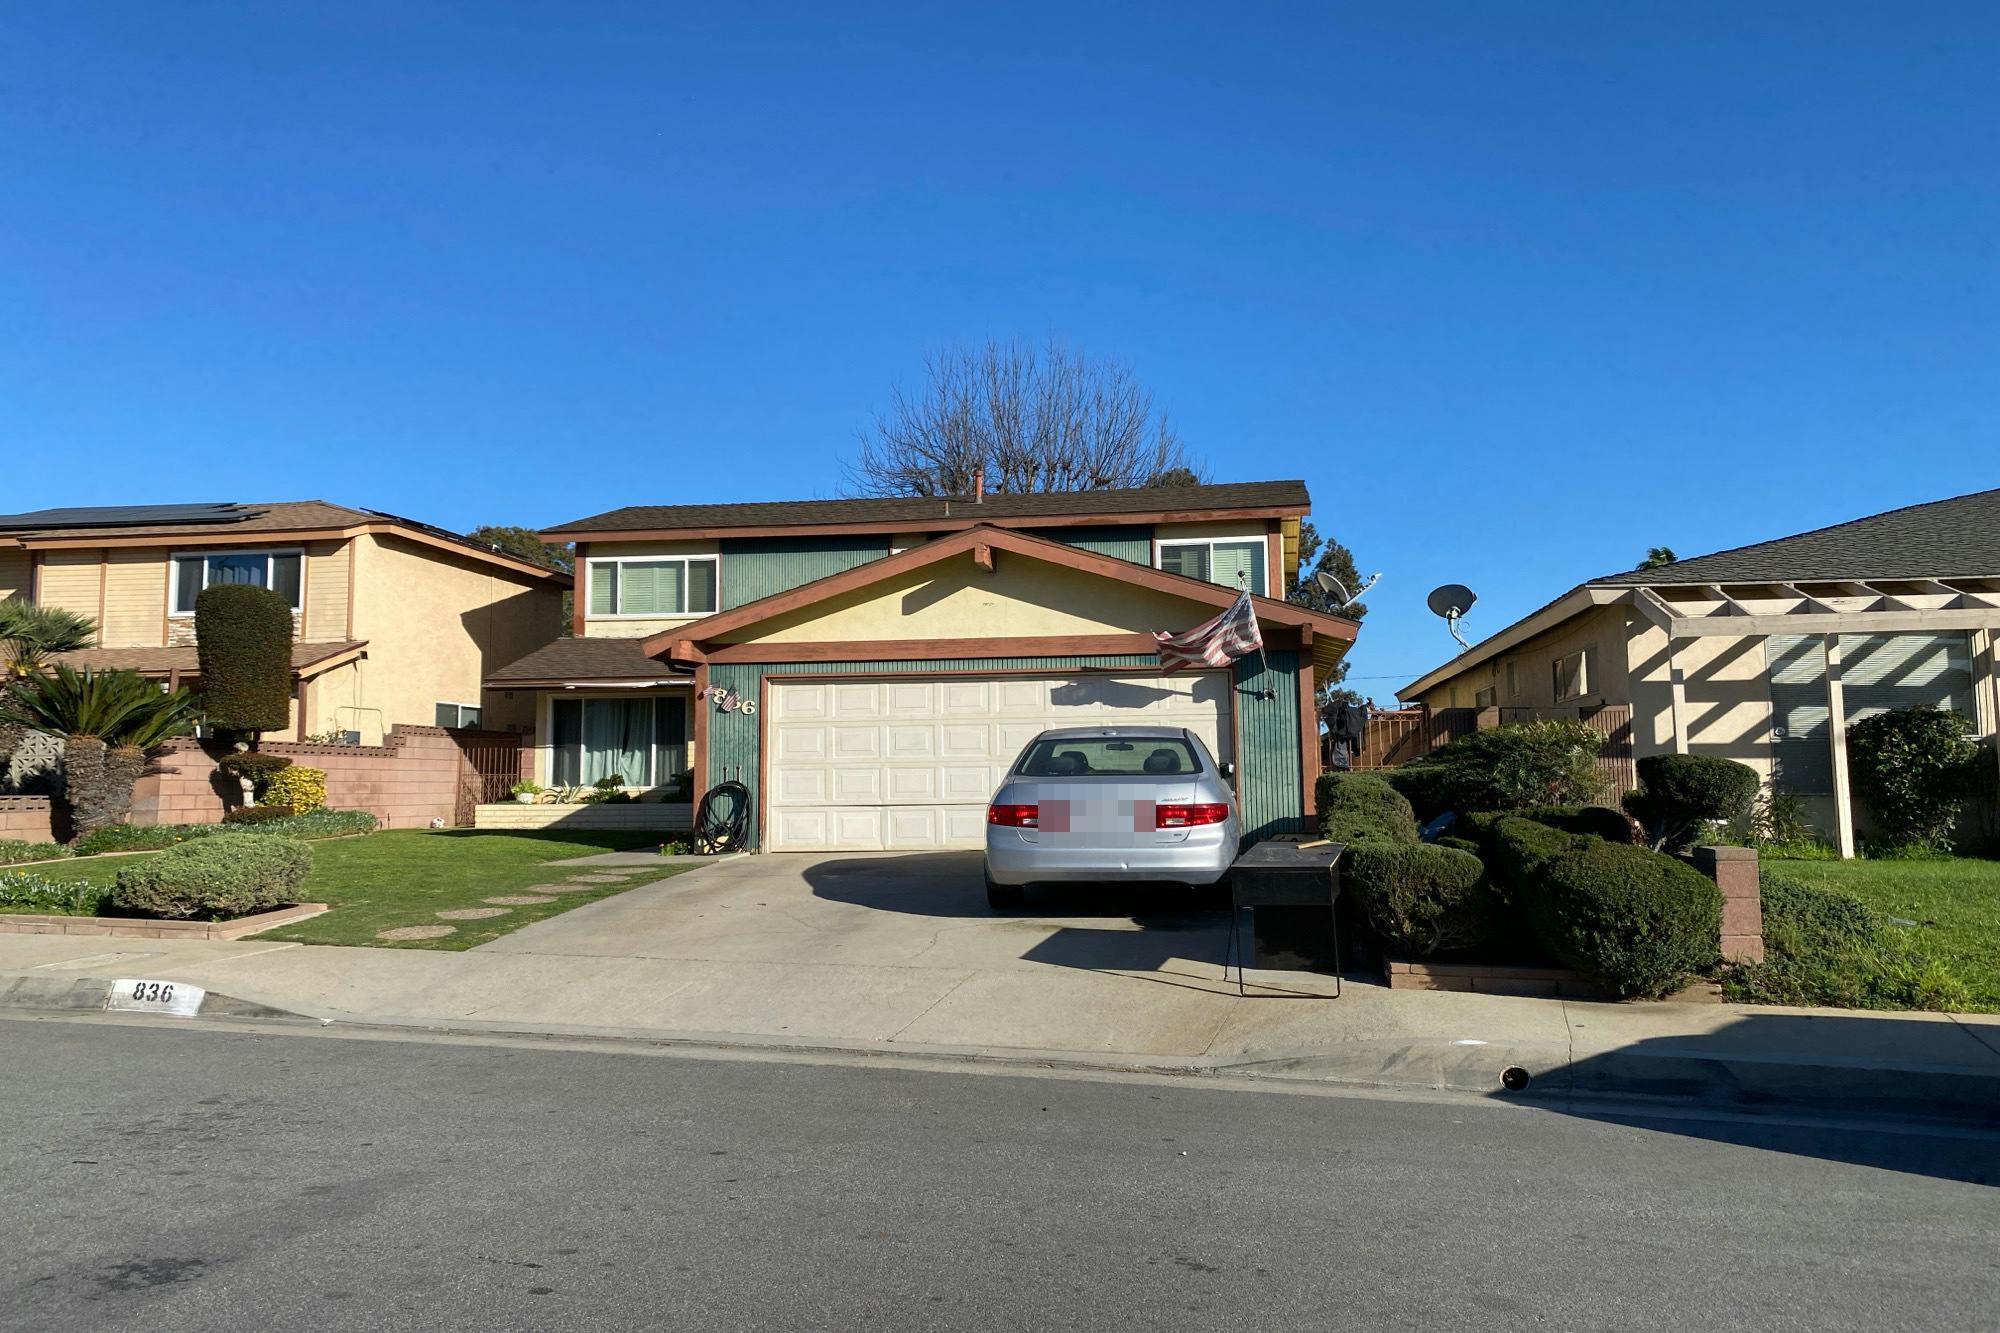
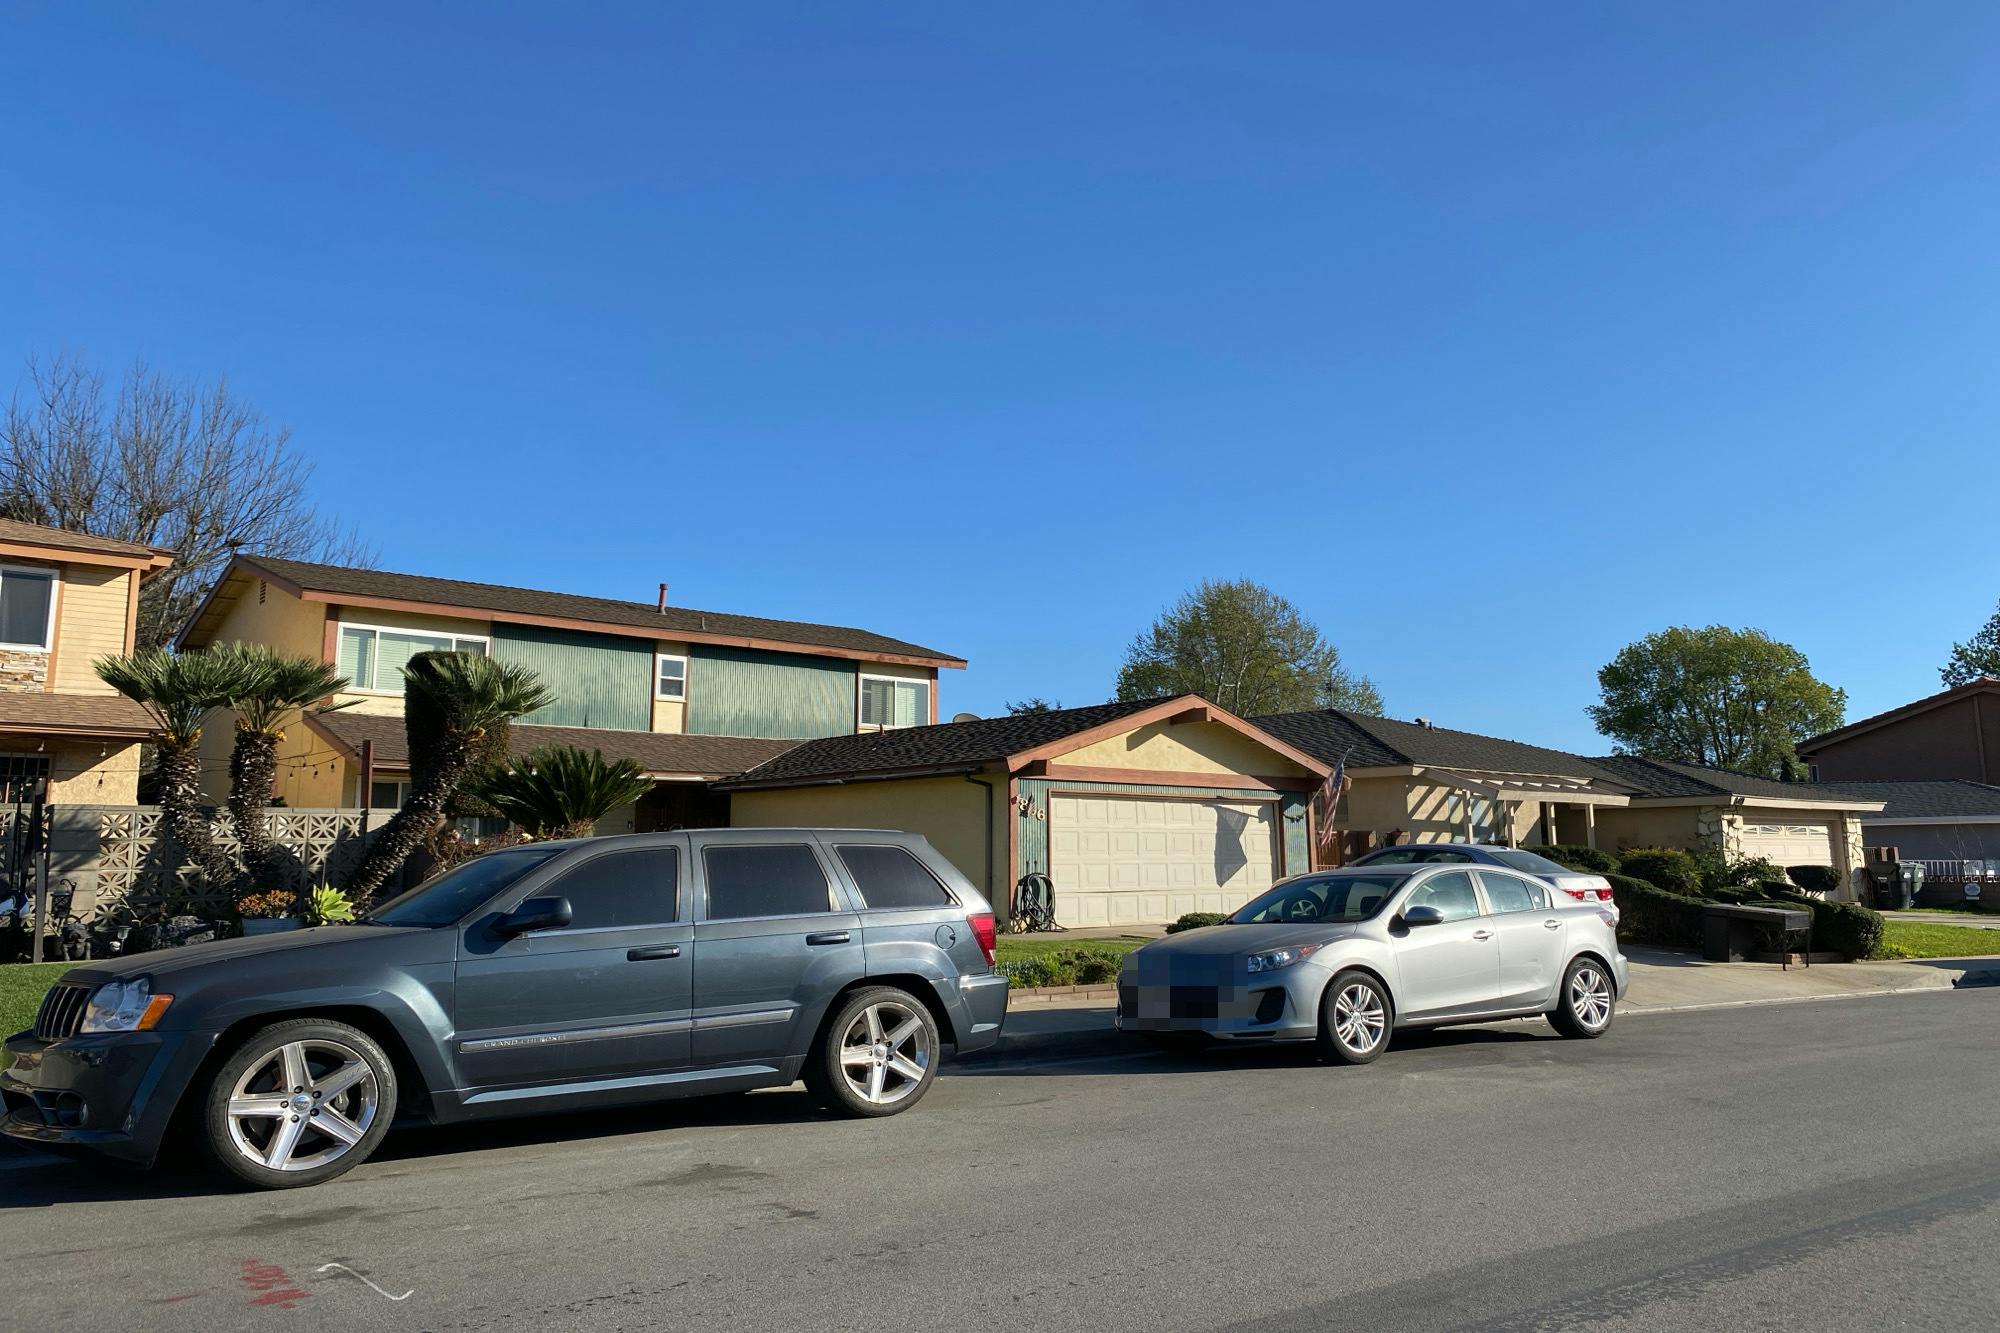
836 S 3rd St, Montebello, CA 90640
Member Features
Find Real Estate Bargain!
Full foreclosure details
Home value, equity and ownership info
Find homes priced below market
Get full access with a FREE Account
Already a member?
For Sale
Off Market
Home type
Price / sqft
Year built
Home Details
Interior Details
2048
4
3
Has Heating:
Yes
Heating Type:
Central
Has Cooling:
No
Cooling Type:
N/A
Has Fuel:
No
Fuel Type:
N/A
Has Basement:
No
Basement Type:
N/A
Has Flooring:
No
Flooring Type:
N/A
Has Fireplace:
Yes
Fireplace Type:
N/A
Property Details
5735
No
No
Type:
N/A
Location:
N/A
Status:
N/A
Number of Spaces:
N/A
N/A
N/A
N/A
N/A
N/A
N/A
N/A
Construction Details
Conventional
Stucco
N/A
Gable
Wood Shingle
Tax History
Year
Amount
Land
Improvement
Percent Change
Assessment
2019
$7,426
$263,745
$251,862
--%
$515,607
2019
$7,426
$258,574
$246,924
--%
$505,498
2018
$7,517
$253,504
$242,083
--%
$495,587
2017
$7,353
$248,534
$237,337
--%
$485,871
2016
$7,196
$243,661
$232,684
--%
$476,345
2014
$6,716
$235,300
$224,700
--%
$460,000
2013
$1,710
$18,299
$64,688
--%
$82,987
2012
$1,563
$17,941
$63,420
--%
$81,361

Average Home Price in 90640
Nearby Properties
Zip Code
Price
Bed
Bath
Sqft
Lot
Sold Date
$1,022,999
$1,022,999
3 Beds
3 Baths
1,827 Sqft
7,215 Lot (sqft)
Sold 10/27/2026
$998,000
$998,000
5 Beds
3 Baths
2,296 Sqft
6,846 Lot (sqft)
Sold 10/13/2026
$799,900
$799,900
3 Beds
3 Baths
1,760 Sqft
5,407 Lot (sqft)
Sold 10/27/2026
$1,031,055
$1,031,055
4 Beds
3 Baths
2,048 Sqft
5,735 Lot (sqft)
Sold 10/26/2026
$710,000
$710,000
3 Beds
2 Baths
1,773 Sqft
5,012 Lot (sqft)
Sold 10/27/2026
Calculators
Mortgage
Mortgage Calculator
Details for 836 S 3RD ST
Property Debt
Foreclosure Contact Details
Similar Homes Nearby

Guides for 3 Rd St

In August 2024, LA’s pre-foreclosures plummeted 50% from July and 60% from last year, suggesting better economic conditions or successful homeowner interventions. Similar trends in San Jose, while SF and SD remain stable. Sacramento shows significant improvement. LA’s efforts stand out. #HousingMarket #LosAngeles