Member Features
Find Real Estate Bargain!
Full foreclosure details
Home value, equity and ownership info
Find homes priced below market
Get full access with a FREE Account
Already a member?
$1,568,000
Listing Price--beds
--baths
1,520sqft
5,000sqft lot
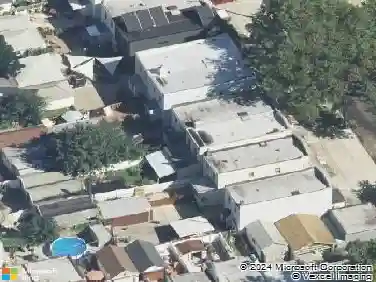
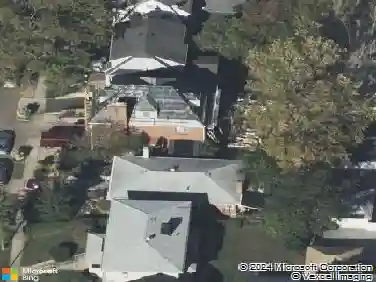
4222 191st St, Flushing, NY 11358
Member Features
Find Real Estate Bargain!
Full foreclosure details
Home value, equity and ownership info
Find homes priced below market
Get full access with a FREE Account
Already a member?
For Sale
Off Market
Home type
Price / sqft
Year built
Home Details
Vacant.Exceptional opportunity in a prime location! This legal two-family brick Colonial sits on a 50x100 lot with R3X zoning (max 3,750 sqft buildable area), offering massive development or investment potential. Perfectly situated just two blocks from the LIRR, steps from Northern Blvd and HuaLian Supermarket, and zoned for great schools. The home features split AC units in every room for efficient heating and cooling. The first floor offers a huge open living room, open kitchen, 3 bedrooms, and 1 bath. The second floor includes an eat-in kitchen, 2 bedrooms, 1 bath, and a walk-up attic with an additional bedroom. The basement features an outside entrance (OSE), a den, 1room, 1bath, and laundry hook-up (washer/dryer excluded). Complete with separate utilities (2 gas/2 electric meters), a fenced/paved yard, a private driveway, and a garage. Selling " As Is". All info is deemed reliable but not guaranteed.
Interior Details
1520
N/A
N/A
Has Heating:
No
Heating Type:
N/A
Has Cooling:
No
Cooling Type:
N/A
Has Fuel:
No
Fuel Type:
N/A
Has Basement:
No
Basement Type:
N/A
Has Flooring:
No
Flooring Type:
N/A
Has Fireplace:
Yes
Fireplace Type:
N/A
Property Details
5000
No
No
Type:
N/A
Location:
N/A
Status:
N/A
Number of Spaces:
N/A
N/A
N/A
N/A
N/A
N/A
N/A
N/A
Construction Details
Duplex Single
N/A
N/A
N/A
N/A
Tax History
Year
Amount
Land
Improvement
Percent Change
Assessment
2020
$8,679
$19,260
$42,120
--%
$61,380
2019
$8,092
$19,260
$41,820
--%
$61,080
2017
$7,033
$12,396
$24,098
--%
$36,494
2017
$7,033
$14,127
$20,376
--%
$34,503
2016
$6,897
$15,298
$19,205
--%
$34,503
2014
$3,012
$17,982
$14,254
--%
$32,236
2013
$5,234
$16,729
$13,683
--%
$30,412
2012
$4,992
$16,664
$12,089
--%
$28,753

Average Home Price in 11358
Nearby Properties
Zip Code
Price
Bed
Bath
Sqft
Lot
Sold Date
$--
-- Beds
-- Baths
1,580 Sqft
3,250 Lot (sqft)
Sold 10/07/2026
$--
-- Beds
-- Baths
1,648 Sqft
2,375 Lot (sqft)
Sold 07/28/2026
$--
-- Beds
-- Baths
1,600 Sqft
4,000 Lot (sqft)
Sold 06/23/2026
$--
3 Beds
2 Baths
1,632 Sqft
2,500 Lot (sqft)
Sold 10/27/2026
$--
-- Beds
-- Baths
1,632 Sqft
2,500 Lot (sqft)
Sold 10/27/2026
$--
-- Beds
-- Baths
1,657 Sqft
3,000 Lot (sqft)
Sold 10/27/2026
$--
4 Beds
2 Baths
1,640 Sqft
2,400 Lot (sqft)
Sold 10/27/2026
$1,568,000
$1,568,000
-- Beds
-- Baths
1,520 Sqft
5,000 Lot (sqft)
Sold 10/27/2026
$--
-- Beds
-- Baths
1,610 Sqft
3,800 Lot (sqft)
Sold 10/27/2026